HelpDesk
How to Remove ConceptDraw Products from Mac and PC
CS Odessa provides registered users a 21 day trial period at no charge. A Trial License can be used to run a fully functional version of ConceptDraw products for 21 days. Trial mode functions exactly as a fully licensed copy of the product does. After your trial has expired and you have not yet purchased a license, the product reverts to Demo mode. The following article contains the instruction for those trial users who want to remove ConceptDraw products after the trial period is over.HelpDesk
How to Draw a Chemical Process Flow Diagram
Process Flow Diagram widely used in modeling of processes in the chemical industry. A Chemical Process Flow diagram (PFD) is a specialized type of flowchart. With the help of Chemical Process Flow Diagram engineers can easily specify the general scheme of the processes and chemical plant equipment. Chemical Process Flow Diagram displays the real scheme of the chemical process, the relationship between the equipment and the technical characteristics of the process. Chemical Process Flow Diagram illustrates the connections between the basic equipment as well as the overall structure of pipelines and other supporting equipment. The purpose of the PFD is to build the image of the basic idea of the chemical process. ConceptDraw PRO together with its Chemical and Process Engineering solution delivers the possibility to design Chemical Process Flow diagrams. It is designed for chemical industry engineers and designers.Design Element: Rack Diagram for Network Diagrams
ConceptDraw PRO is perfect for software designers and software developers who need to draw Rack Diagrams.
HelpDesk
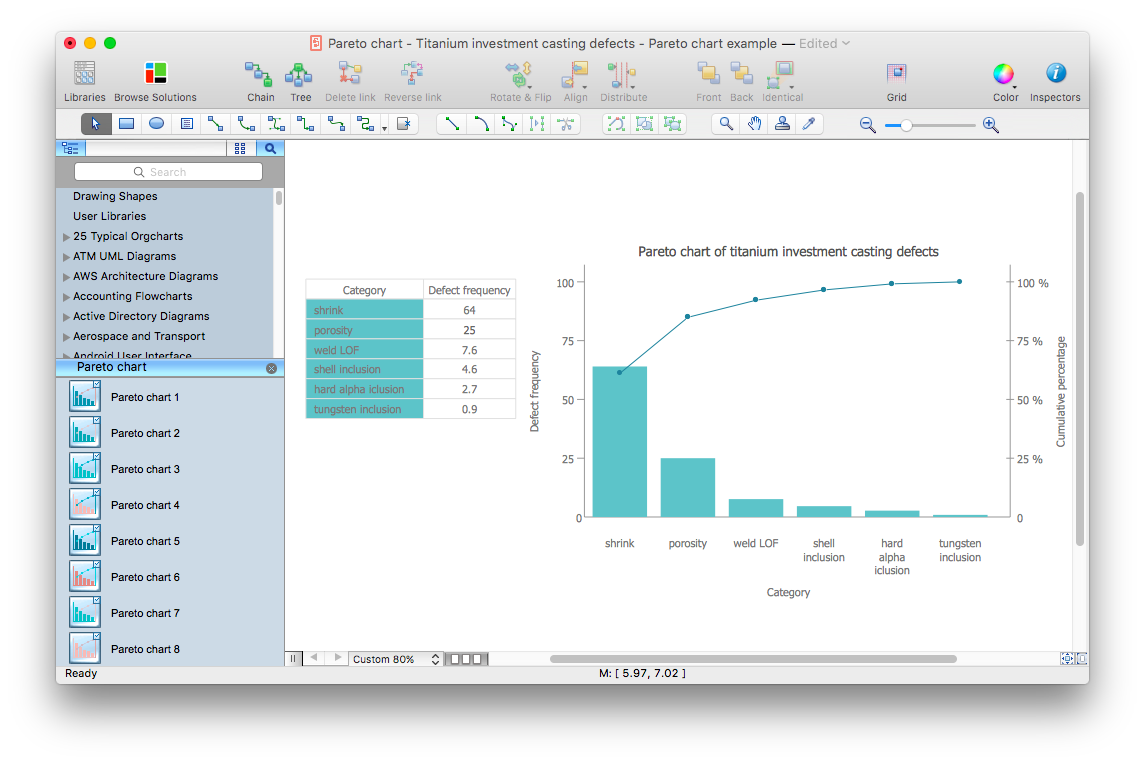
How to Draw a Pareto Chart Using ConceptDraw PRO
The Seven Basic Tools of Quality were picked as effective visual tool-set for identifying the root cause of quality-related problems within the workplace. Seven Basic Tools of Quality comprise of seven diagram that are diverse enough to be used to any business troubleshooting scenario, but simple enough that employees of all types can understand and apply them. One of these tools is a Pareto chart. It combines both a line graph and a bar chart, where the bar chart displays data values, and a line represents a total value. Pareto chart is used for quality control to identify the source of the quality problem.ConceptDraw Seven Basic Tools of Quality solution delivers a big set of vector stencil libraries and samples for each quality control diagram, including a Pareto chart.
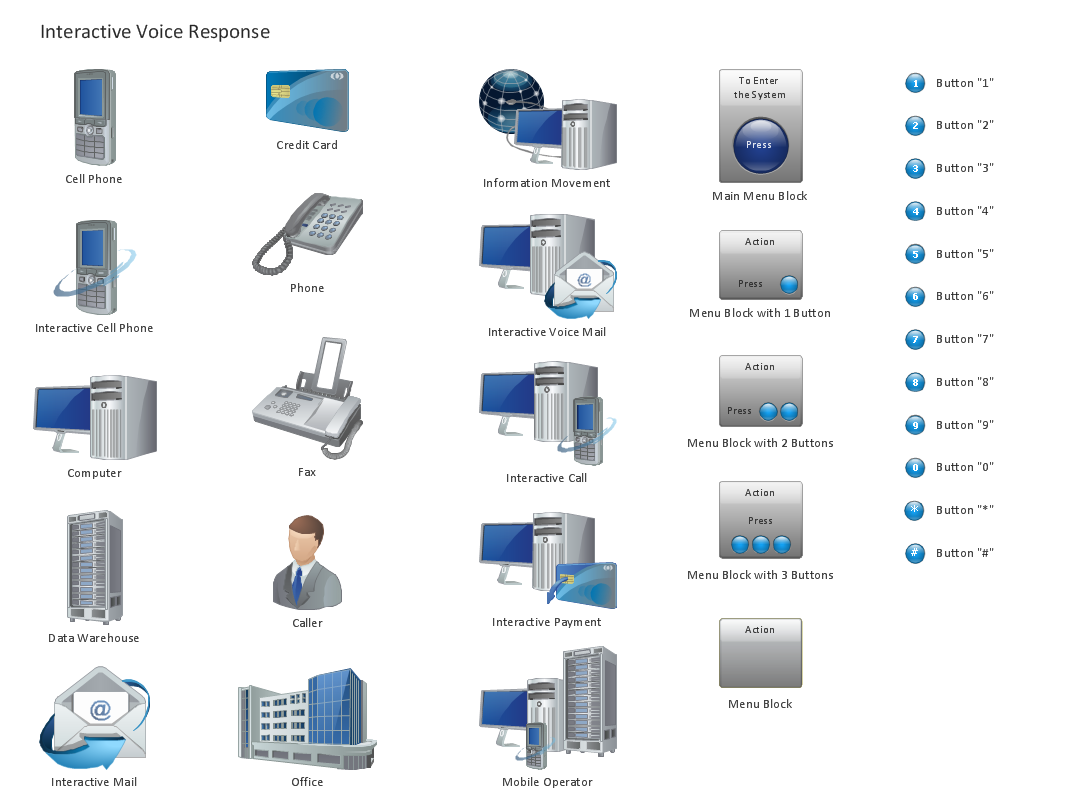
Design Element: IVR for Network Diagrams
ConceptDraw PRO is perfect for software designers and software developers who need to draw IVR Network Diagrams.
- Electrical Drawing
- How To use House Electrical Plan Software | Home Electrical Plan ...
- Electrical Control Panel Board Wiring Diagram Symbol
- Draw Wiring Diagram Security System
- Telecommunication Network Diagrams | Telecommunication ...
- 2-bit ALU - Logic gate diagram | Initiation and annunciation - Vector ...
- How To use House Electrical Plan Software | Design elements ...
- Electrical Diagrams
- How to Draw a Security and Access Floor Plan | Physical Security ...
- Electrical Drawing Software and Electrical Symbols | Electrical ...
- Wiring Schematics Software
- Cisco Express Forwarding - Network topology diagram | Server rack ...
- How to Draw a Computer Network Diagrams
- Flow Diagram Control Panel Symbol
- Telecommunication Network Diagrams | Design elements ...
- Layout Diagram Door Access Control
- Electrical Control Panel Layout Software Free Download
- Computers and Communications | Design elements - Telecom ...
- Telecommunication networks. Computer and Network Examples ...
- Security and Access Plans | How to Draw a Security and Access ...
- ERD | Entity Relationship Diagrams, ERD Software for Mac and Win
- Flowchart | Basic Flowchart Symbols and Meaning
- Flowchart | Flowchart Design - Symbols, Shapes, Stencils and Icons
- Flowchart | Flow Chart Symbols
- Electrical | Electrical Drawing - Wiring and Circuits Schematics
- Flowchart | Common Flowchart Symbols
- Flowchart | Common Flowchart Symbols


.png)

