Pyramid Diagram
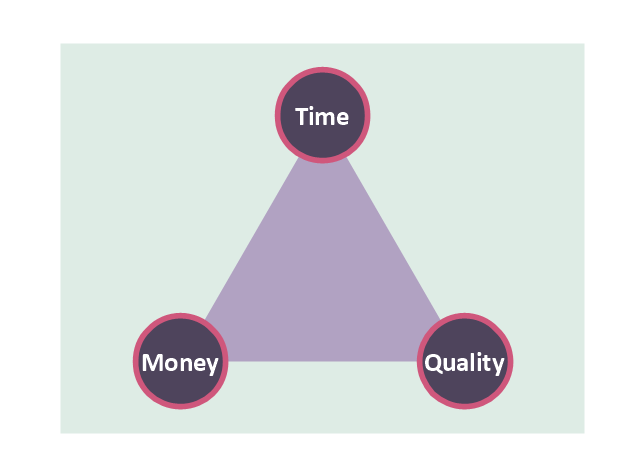
The Time-Money-Quality Triangle illustrates an advertising truism, that you can't have all three.HelpDesk
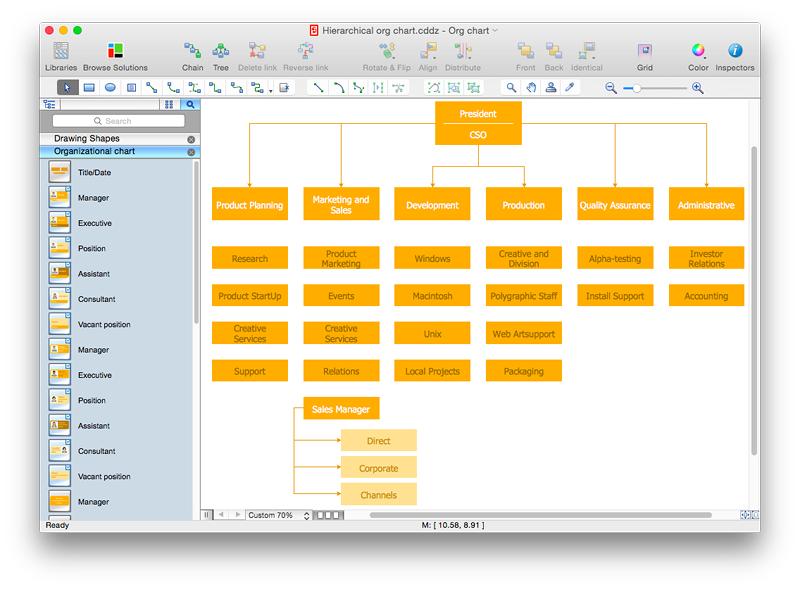
How to Draw a Hierarchical Organizational Chart with ConceptDraw PRO
There are a number of different organisational structures. The most appropriate structure will depend on the size of the business and the type of business. A hierarchical organizational structure is one of the most typical organizational structure. This structure can be represented as a pyramid, with a single entity in authority at the top, with subsequent levels of power beneath them. Each member of the pyramid reports only to their direct subordinates or superiors, limiting the amount of communication overhead, which can be seen both as an asset or a limitation. It is easy to see where a hierarchical structure would be an effective solution; companies that have offices based in disparate locations, a business that focuses on diversified markets, any organization with need for multiple levels of middle management. You can easily create a clear hierarchical organizational chart using ConceptDraw solution that contains templates of the 25 Typical Orgcharts.Pyramid Diagram
Pyramid diagrams help you visualize information as a triangle divided into horizontal slices. Labelled slices represent a hierarchy. Pyramids are used in marketing presentations to show and analyze hierarchy levels.3D triangular diagram of DIKW pyramid has 6 levels: measurement, facts, data, information, knowledge, wisdom.
The data component include different scattered signs or symbols which are merely useless until these random objective facts are somehow processed. Data is a resource which has to be manipulated or rearranged to get useful. Information can be extracted from a pile of data, it also can be mined from different data storages.
Process Flowchart
ConceptDraw is Professional business process mapping software for making process flow diagram, workflow diagram, general flowcharts and technical illustrations for business documents. It is includes rich examples, templates, process flowchart symbols. ConceptDraw flowchart maker allows you to easier create a process flowchart. Use a variety of drawing tools, smart connectors, flowchart symbols and shape libraries to create flowcharts of complex processes, process flow diagrams, procedures and information exchange.
"The Time/ Money/ Quality Triangle illustrates an advertising truism, that "you can't have all three." If there is little time or money, then ad quality will suffer. The more time and/ or money that is available to the project, the higher the quality can be. However, the level of quality must be appropriate to the product...not all products should have high-quality ads!" [Advertising/ Strategies. Wikibooks]
This triangular diagram example was redesigned using the ConceptDraw PRO diagramming and vector drawing software from Wikimedia Commons file Time-Quality-Money.png. [commons.wikimedia.org/ wiki/ File:Time-Quality-Money.png]
This file is licensed under the Creative Commons Attribution-Share Alike 3.0 Unported license. [creativecommons.org/ licenses/ by-sa/ 3.0/ deed.en]
The chart sample "Time, quality, money triangle diagram" is included in the Pyramid Diagrams solution from the Marketing area of ConceptDraw Solution Park.
- Pyramid Diagram | Organizational Structure | Pyramid Diagram ...
- Flow chart Example. Warehouse Flowchart | 4 Level pyramid model ...
- 5 Level pyramid model diagram - Information systems types ...
- Cross-Functional Flowchart | Process Flow Chart | Pyramid Diagram ...
- Process Flowchart | 5 Level pyramid model diagram - Information ...
- Pyramid Diagram | Organizational Structure | Landscape ...
- Pyramid Diagram | Pyramid Diagram | 4 Level pyramid model ...
- 3D Network Diagram Software | Pyramid Diagram | 3D Network ...
- Level 4 Process Diagram
- How to Draw a Pyramid Diagram in ConceptDraw PRO | Network ...
- Pyramid Diagram | Types of Flowcharts | Pyramid Diagram | Three ...
- How to Draw an Organization Chart | Organizational Structure ...
- Flow chart Example. Warehouse Flowchart | Organization chart ...
- Pyramid Diagram | Structured Systems Analysis and Design Method ...
- Illustration Of Levels Of Management
- Flow chart Example. Warehouse Flowchart | Organization chart ...
- Pyramid Diagram | Process Flowchart | HR Flowcharts | With An ...
- 3D Block diagram template
- Pyramid Diagram | Taxi service order procedure - BPMN 1.2 ...
- Take One Organisation As An Example And Discuss Level Of ...
- ERD | Entity Relationship Diagrams, ERD Software for Mac and Win
- Flowchart | Basic Flowchart Symbols and Meaning
- Flowchart | Flowchart Design - Symbols, Shapes, Stencils and Icons
- Flowchart | Flow Chart Symbols
- Electrical | Electrical Drawing - Wiring and Circuits Schematics
- Flowchart | Common Flowchart Symbols
- Flowchart | Common Flowchart Symbols


