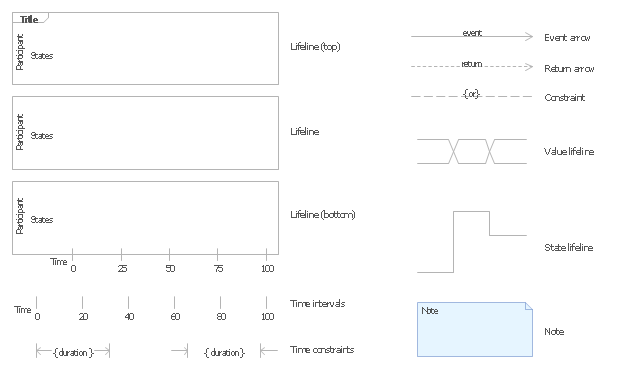
The vector stencils library "UML timing diagrams" contains 15 symbols for the ConceptDraw PRO diagramming and vector drawing software.
"The following nodes and edges are typically drawn in a UML timing diagram: lifeline, state or condition timeline, destruction event, duration constraint, time constraint. ...
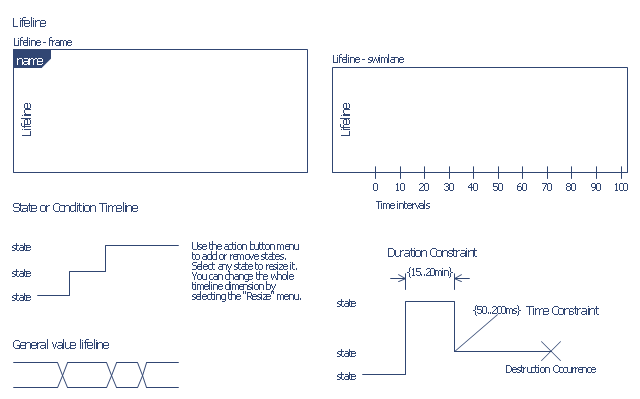
Lifeline is a named element which represents an individual participant in the interaction. ... lifelines represent only one interacting entity. ...
Lifeline on the timing diagrams is represented by the name of classifier or the instance it represents. It could be placed inside diagram frame or a "swimlane". ...
Timing diagram could show states of the participating classifier or attribute, or some testable conditions, such as a discrete or enumerable value of an attribute. ...
UML also allows the state/ condition dimension be continuous. It could be used in scenarios where entities undergo continuous state changes, such as temperature or density. ...
Destruction occurrence is a message occurrence which represents the destruction of the instance described by the lifeline. It may result in the subsequent destruction of other objects that this object owns by composition. No other occurrence may appear after the destruction event on a given lifeline.
Complete UML name of the occurrence is destruction occurrence specification. Until UML 2.4 it was called destruction event, and earlier - stop.
The destruction event is depicted by a cross in the form of an X at the end of a timeline. ...
Duration constraint is an interval constraint that refers to a duration interval. The duration interval is duration used to determine whether the constraint is satisfied.
The semantics of a duration constraint is inherited from constraints. If constraints are violated, traces become negative which means that system is considered as failed.
Duration constraint is shown as some graphical association between a duration interval and the constructs that it constrains. ...
Time constraint is an interval constraint that refers to a time interval. The time interval is time expression used to determine whether the constraint is satisfied.
The semantics of a time constraint is inherited from constraints. All traces where the constraints are violated are negative traces, i.e., if they occur, the system is considered as failed.
Time constraint is shown as graphical association between a time interval and the construct that it constrains. Typically this graphical association is a small line, e.g., between an occurrence specification and a time interval." [uml-diagrams.org/ timing-diagrams.html]
The example "Design elements - UML timing diagrams" is included in the Rapid UML solution from the Software Development area of ConceptDraw Solution Park.
"The following nodes and edges are typically drawn in a UML timing diagram: lifeline, state or condition timeline, destruction event, duration constraint, time constraint. ...
Lifeline is a named element which represents an individual participant in the interaction. ... lifelines represent only one interacting entity. ...
Lifeline on the timing diagrams is represented by the name of classifier or the instance it represents. It could be placed inside diagram frame or a "swimlane". ...
Timing diagram could show states of the participating classifier or attribute, or some testable conditions, such as a discrete or enumerable value of an attribute. ...
UML also allows the state/ condition dimension be continuous. It could be used in scenarios where entities undergo continuous state changes, such as temperature or density. ...
Destruction occurrence is a message occurrence which represents the destruction of the instance described by the lifeline. It may result in the subsequent destruction of other objects that this object owns by composition. No other occurrence may appear after the destruction event on a given lifeline.
Complete UML name of the occurrence is destruction occurrence specification. Until UML 2.4 it was called destruction event, and earlier - stop.
The destruction event is depicted by a cross in the form of an X at the end of a timeline. ...
Duration constraint is an interval constraint that refers to a duration interval. The duration interval is duration used to determine whether the constraint is satisfied.
The semantics of a duration constraint is inherited from constraints. If constraints are violated, traces become negative which means that system is considered as failed.
Duration constraint is shown as some graphical association between a duration interval and the constructs that it constrains. ...
Time constraint is an interval constraint that refers to a time interval. The time interval is time expression used to determine whether the constraint is satisfied.
The semantics of a time constraint is inherited from constraints. All traces where the constraints are violated are negative traces, i.e., if they occur, the system is considered as failed.
Time constraint is shown as graphical association between a time interval and the construct that it constrains. Typically this graphical association is a small line, e.g., between an occurrence specification and a time interval." [uml-diagrams.org/ timing-diagrams.html]
The example "Design elements - UML timing diagrams" is included in the Rapid UML solution from the Software Development area of ConceptDraw Solution Park.
UML timing diagram symbols
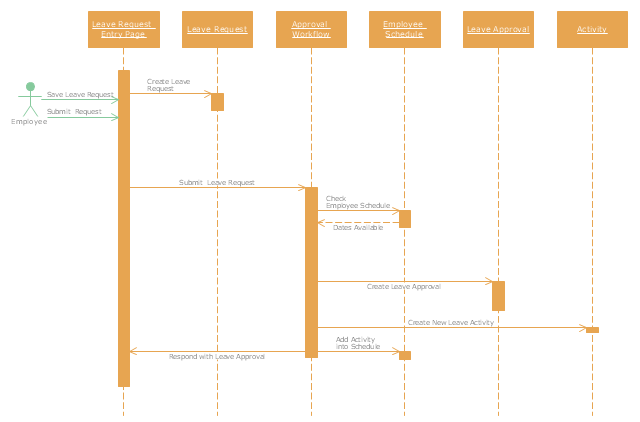
"A schedule or timetable is a basic time management tool consisting of a list of times at which possible tasks, events, or actions are intended to take place, or a sequence of events in the chronological order in which such things are intended to take place. The process of creating a schedule - deciding how to order these tasks and how to commit resources between the variety of possible tasks - is called scheduling, and a person responsible for making a particular schedule may be called a scheduler. Making and following schedules is a fundamental human activity, and learning to do these things effectively is one of the most basic life skills. There are a wide variety of situations in which schedules are necessary, or at least useful.
Schedules are useful for both short periods, such as a daily or weekly schedule, and for long term planning with respect to periods of several months or years. They are often made using a calendar, where the person making the schedule can note the dates and times at which various events are planned to occur. Schedules that do not set forth specific times for events to occur may instead list an expected order in which events either can or must take place." [Schedule. Wikipedia]
The UML sequence diagram example "Checking process" was created using the ConceptDraw PRO diagramming and vector drawing software extended with the Rapid UML solution from the Software Development area of ConceptDraw Solution Park.
UML sequence diagram
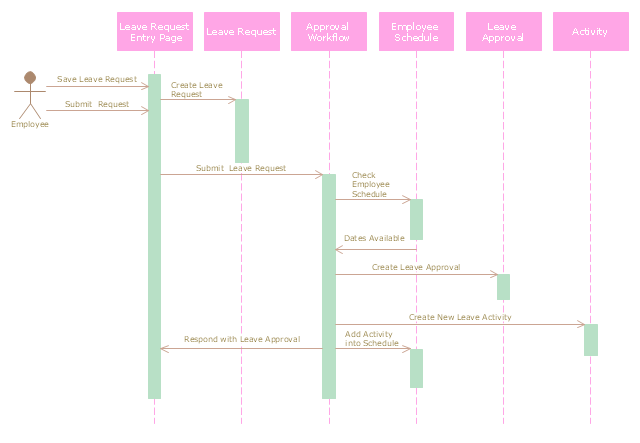
"A sequence diagram is an interaction diagram that shows how processes operate with one another and in what order. It is a construct of a Message Sequence Chart. A sequence diagram shows object interactions arranged in time sequence. It depicts the objects and classes involved in the scenario and the sequence of messages exchanged between the objects needed to carry out the functionality of the scenario. Sequence diagrams are typically associated with use case realizations in the Logical View of the system under development. Sequence diagrams are sometimes called event diagrams, event scenarios." [Sequence diagram. Wikipedia]
This UML sequence diagram example was created using the ConceptDraw PRO diagramming and vector drawing software extended with the Rapid UML solution from the Software Development area of ConceptDraw Solution Park.
This UML sequence diagram example was created using the ConceptDraw PRO diagramming and vector drawing software extended with the Rapid UML solution from the Software Development area of ConceptDraw Solution Park.
UML sequence diagram
Fishbone Diagram Problem Solving

UML Sequence Diagram. Design Elements
")

The vector stencils library "Bank UML timing diagram" contains 8 shapes for drawing UML timing diagrams.
Use it for object-oriented modeling of your bank information system.
"A timing diagram in the Unified Modeling Language 2.0 is a specific type of interaction diagram, where the focus is on timing constraints.
Timing diagrams are used to explore the behaviors of objects throughout a given period of time. A timing diagram is a special form of a sequence diagram. The differences between timing diagram and sequence diagram are the axes are reversed so that the time is increased from left to right and the lifelines are shown in separate compartments arranged vertically.
There are two basic flavors of timing diagram: the concise notation, and the robust notation." [Timing diagram. Wikipedia]
This example of UML timing diagram symbols for the ConceptDraw PRO diagramming and vector drawing software is included in the ATM UML Diagrams solution from the Software Development area of ConceptDraw Solution Park.
UML timing diagram symbols
 Fishbone Diagrams
The Fishbone Diagrams solution extends ConceptDraw PRO v10 software with the ability to easily draw the Fishbone Diagrams (Ishikawa Diagrams) to clearly see the cause and effect analysis and also problem solving. The vector graphic diagrams produced using this solution can be used in whitepapers, presentations, datasheets, posters, and published technical material.
UML Composite Structure Diagram. Design Elements

Fishbone Software Tools for Design Element
_Win_Mac.png "Fishbone Software Tools for Design Element")
HelpDesk
How To Create Root Cause Analysis Diagram Using ConceptDraw Office

- Design elements - UML timing diagrams | Orders by months - Time ...
- Design elements - UML timing diagrams
- Design elements - UML timing diagrams | Vector stencils library ...
- Diagramming Software for Design UML Timing Diagrams | Timing ...
- UML Sequence Diagram . Design Elements | UML Collaboration ...
- Diagramming Software for Design UML Timing Diagrams | UML ...
- Timing diagram | Diagramming Software for Design UML Timing ...
- How to Create a BPMN Diagram Using ConceptDraw PRO | Event ...
- How to Diagram Sentences in ConceptDraw PRO | UML Notation ...
- Diagramming Software for Design UML Timing Diagrams | Timing ...
- UML sequence diagram - Template
- Pyramid Diagram | Flowchart design. Flowchart symbols, shapes ...
- Example If Time Line Diagram
- How to Create a Timeline Diagram in ConceptDraw PRO | Design ...
- UML Object Diagram . Design Elements | UML Deployment Diagram ...
- UML Sequence Diagram Example. SVG Vectored UML Diagrams ...
- UML communication diagram - Template | UML deployment diagram ...
- Entity-Relationship Diagram (ERD) with ConceptDraw PRO | Cross ...
- Entity-Relationship Diagram (ERD)
- Business Process Elements: Events | BPMN 2.0 | Business Process ...