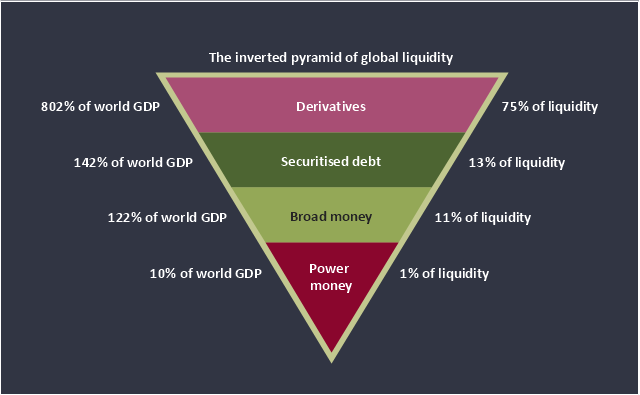
This inverted pyramid diagram of global liquidity shows world GDP and liquidity for 4 levels: derivatives, securitised debt, broad money, and power money.
"In business, economics or investment, market liquidity is a market's ability to facilitate an asset being sold quickly without having to reduce its price very much (or even at all). Equivalently, an asset's market liquidity (or simply "an asset's liquidity") is the asset's ability to sell quickly without having to reduce its price very much. Liquidity is about how big the trade-off is between the speed of the sale and the price it can be sold for. In a liquid market, the trade-off is mild: selling quickly will not reduce the price much. In a relatively illiquid market, selling it quickly will require cutting its price by some amount.
Money, or cash, is the most liquid asset, because it can be "sold" for goods and services instantly with no loss of value. There is no wait for a suitable buyer of the cash. There is no trade-off between speed and value. It can be used immediately to perform economic actions like buying, selling, or paying debt, meeting immediate wants and needs.
If an asset is moderately (or very) liquid, it has moderate (or high) liquidity. In an alternative definition, liquidity can mean the amount of highly liquid assets. If a business has moderate liquidity, it has a moderate amount of very liquid assets. If a business has sufficient liquidity, it has a sufficient amount of very liquid assets and the ability to meet its payment obligations." [Market liquidity. Wikipedia]
This inverted triangle diagram was redesigned using the ConceptDraw PRO diagramming and vector drawing software from Wikimedia Commons file The inverted pyramid of global liquidity.gif. [commons.wikimedia.org/ wiki/ File:The_ inverted_ pyramid_ of_ global_ liquidity.gif]
This triangular chart example is included in the Pyramid Diagrams solution from the Marketing area of ConceptDraw Solution Park.
Inverted pyramid diagram
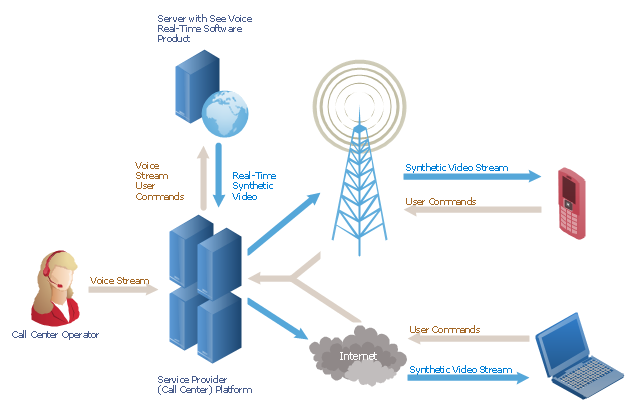
"A call centre or call center is a centralised office used for the purpose of receiving or transmitting a large volume of requests by telephone. An inbound call centre is operated by a company to administer incoming product support or information inquiries from consumers. Outbound call centers are operated for telemarketing, solicitation of charitable or political donations, debt collection and market research. In addition to a call centre, collective handling of letter, fax, live support software,social media and e-mail at one location is known as a contact centre.
A call centre is operated through an extensive open workspace for call centre agents, with work stations that include a computer for each agent, a telephone set or headset connected to a telecom switch, and one or more supervisor stations. It can be independently operated or networked with additional centres, often linked to a corporate computer network, including mainframes, microcomputers and LANs. Increasingly, the voice and data pathways into the centre are linked through a set of new technologies called computer telephony integration (CTI)." [Call centre. Wikipedia]
This call center network diagram example was created using the ConceptDraw PRO diagramming and vector drawing software extended with the Telecommunication Network Diagrams solution from the Computer and Networks area of ConceptDraw Solution Park.
Network scheme
Pyramid Diagram

Financial Comparison Chart

Flowchart on Bank. Flowchart Examples

This sample shows the Flowchart of the Subprime Mortgage Crisis. This Flowchart describes the decline in housing prices when the housing bubble burst and what it caused on the housing and financial markets. You can also see the Government and Industry responses in this crisis situation.

- Circle-spoke diagram - Target market | Process Flowchart | Event ...
- Market value - Pyramid diagram | Circle-spoke diagram - Target ...
- Market value - Pyramid diagram | Six Markets Model Chart | Target ...
- Market value - Pyramid diagram | Target market | Six market models ...
- Consumer Market Diagram
- Diagram Draw Marketing And Selling
- Pyramid Diagram | Purchase funnel diagram | Funnel diagram ...
- Call center network diagram | Basic Flowchart Symbols and ...
- Call center network diagram | Trouble ticket system - BPMN 2.0 ...
- Call center network diagram | Telecommunication Network ...
- Call center network diagram | Network Diagram Software IVR ...
- Satellite telecom network diagram | Call center network diagram ...
- Call center network diagram | Computers and network isometric ...
- SWOT analysis matrix diagram templates | Ansoff's product / market ...
- Call center network diagram | Electrical Symbols, Electrical Diagram ...
- Mainframe Network Diagram
- Leaky bucket diagram | Call center network diagram | Interactive ...
- Communication network diagram | Hybrid Network Topology | Call ...
- Circle-Spoke Diagrams | Circle Diagrams | How to Draw a Circle ...
- Sales Growth. Bar Graphs Example | Bar Chart Examples | Bar ...
- ERD | Entity Relationship Diagrams, ERD Software for Mac and Win
- Flowchart | Basic Flowchart Symbols and Meaning
- Flowchart | Flowchart Design - Symbols, Shapes, Stencils and Icons
- Flowchart | Flow Chart Symbols
- Electrical | Electrical Drawing - Wiring and Circuits Schematics
- Flowchart | Common Flowchart Symbols
- Flowchart | Common Flowchart Symbols