Bar Diagrams for Problem Solving. Create economics and financial bar charts with Bar Graphs Solution

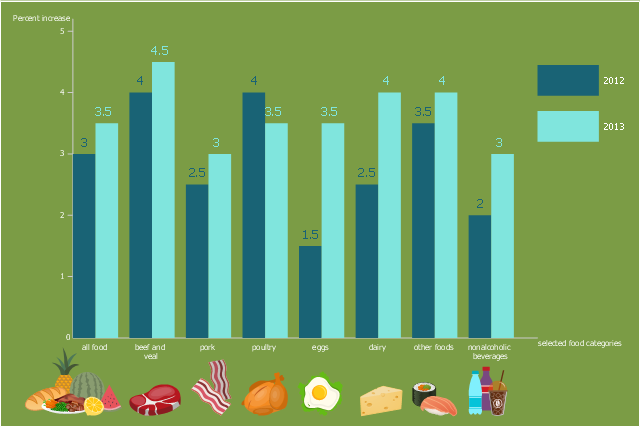
This double bar chart sample shows the forecasted impacts of 2012 drought expected to be larger in 2013 for most foods. It was designed in the base of the graph from the webpage "Price impacts of 2012 drought expected to be larger in 2013 for most foods" on the website of the United States Department of Agriculture Economic Research Service. [ers.usda.gov/ data-products/ chart-gallery/ detail.aspx?chartId=29456&ref=collection#.Ue5MMaxad5I]
"A price index (plural: “price indices” or “price indexes”) is a normalized average (typically a weighted average) of price relatives for a given class of goods or services in a given region, during a given interval of time. It is a statistic designed to help to compare how these price relatives, taken as a whole, differ between time periods or geographical locations.
Price indexes have several potential uses. For particularly broad indices, the index can be said to measure the economy's general price level or a cost of living. More narrow price indices can help producers with business plans and pricing. Sometimes, they can be useful in helping to guide investment." [Price index. Wikipedia]
The column chart example "Changes in price indices" was created using the ConceptDraw PRO diagramming and vector drawing software extended with the Bar Graphs solution from the Graphs and Charts area of ConceptDraw Solution Park.
Double bar graph
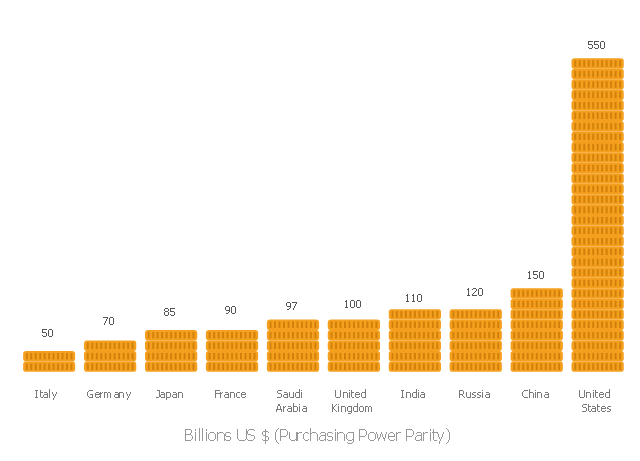
This pictorial bar chart sample shows visual comarison of top ten countries by military expenditure for 2007 by purchasing power parity (PPP) at constant (2005) prices and exchange rates.
It was designed on the base of the Wikimedia Commons file: 2007 top 10 countries by military expenditure PPP.svg.
[commons.wikimedia.org/ wiki/ File:2007_ top_ 10_ countries_ by_ military_ expenditure_ PPP.svg]
"A military budget (or military expenditure), also known as a defense budget, is the amount of financial resources dedicated by an entity (most often a nation or a state), to raising and maintaining an armed forces. Military budgets often reflect how strongly an entity perceives the likelihood of threats against it, or the amount of aggression it wishes to employ. It also gives an idea of how much financing should be provided for the upcoming year. The size of a budget also reflects the entity's ability to fund military activities. Factors include the size of that entity's economy, other financial demands on that entity, and the willingness of that entity's government or people to fund such military activity. Generally excluded from military expenditures is spending on internal law enforcement and disabled veteran rehabilitation." [Military budget. Wikipedia]
The picture bar chart example "2007 top 10 countries by military expenditure PPP" was created using the ConceptDraw PRO diagramming and vector drawing software extended with the Picture Graphs solution from the Graphs and Charts area of ConceptDraw Solution Park.
Picture bar graph
Hotel Plan. Hotel Plan Examples

- Bar Diagrams for Problem Solving. Create manufacturing and ...
- Bar Chart Examples | Bar Diagrams for Problem Solving. Create ...
- Bar Diagrams for Problem Solving. Create economics and financial ...
- Fishbone Diagram | Bar Diagrams for Problem Solving. Create ...
- Exploded pie chart - Sector weightings | Bar Diagrams for Problem ...
- Financial Comparison Chart | Bar Diagrams for Problem Solving ...
- Financial Comparison Chart | Bar Diagrams for Problem Solving ...
- Pie Chart Examples and Templates | Bar Diagrams for Problem ...
- Basic Diagramming | Line Graphs | Scatter chart - MENA's (Middle ...
- Bar Chart Examples | Sales Growth. Bar Graphs Example | Financial ...
- Bar Graph
- Bar Graphs | Double bar chart - Changes in price indices | Bar ...
- Line graph - France exports of goods and services | How to Create a ...
- Bar Chart Software | Bar Chart Examples | How to Create a Bar ...
- Bar Graphs
- Business diagrams & Org Charts with ConceptDraw PRO | Work ...
- Chart Examples | Line Chart Examples | Bar Chart Examples | Area ...
- Line graph - France exports of goods and services | Ecosystem ...
- Changes in price indices - Double bar chart | Nitrate concentration in ...
- Venn Diagram Examples for Problem Solving. Environmental Social ...