HelpDesk
How to Draw a Pie Chart
A pie chart represents data, in a clear and easy to read around (pie) form. A circular pie chart is divided into sections (slice). Each "slice" depicts the It reflects the proportion of each component in the whole "pie". This type of chart is most often used for the visualization of statistical data. That is why pie charts are widely used in marketing. As the pie charts show proportional parts of a whole, they are good for various visual comparisons. For example, it is difficult to imagine a more intuitive way to show segmentation and market share. ConceptDraw DIAGRAM allows you to draw a simple and clear Pie Chart using the Pie Charts solution.HelpDesk
How to Start Drawing a Diagram on Mac
There are many types of diagrams, you can create using ConceptDraw DIAGRAM: network diagrams, organizational charts, flowcharts, workflow diagrams, technical schemes, and building plans. However, there are the same basic steps to start creating almost all of them. Here the tutorial we will show how to create a simple chart using a template, and how to add shapes to your drawing using libraries.
In this tutorial, we will explain how to create a simple chart in ConceptDraw DIAGRAM using a template, and how to use the library objects.
HelpDesk
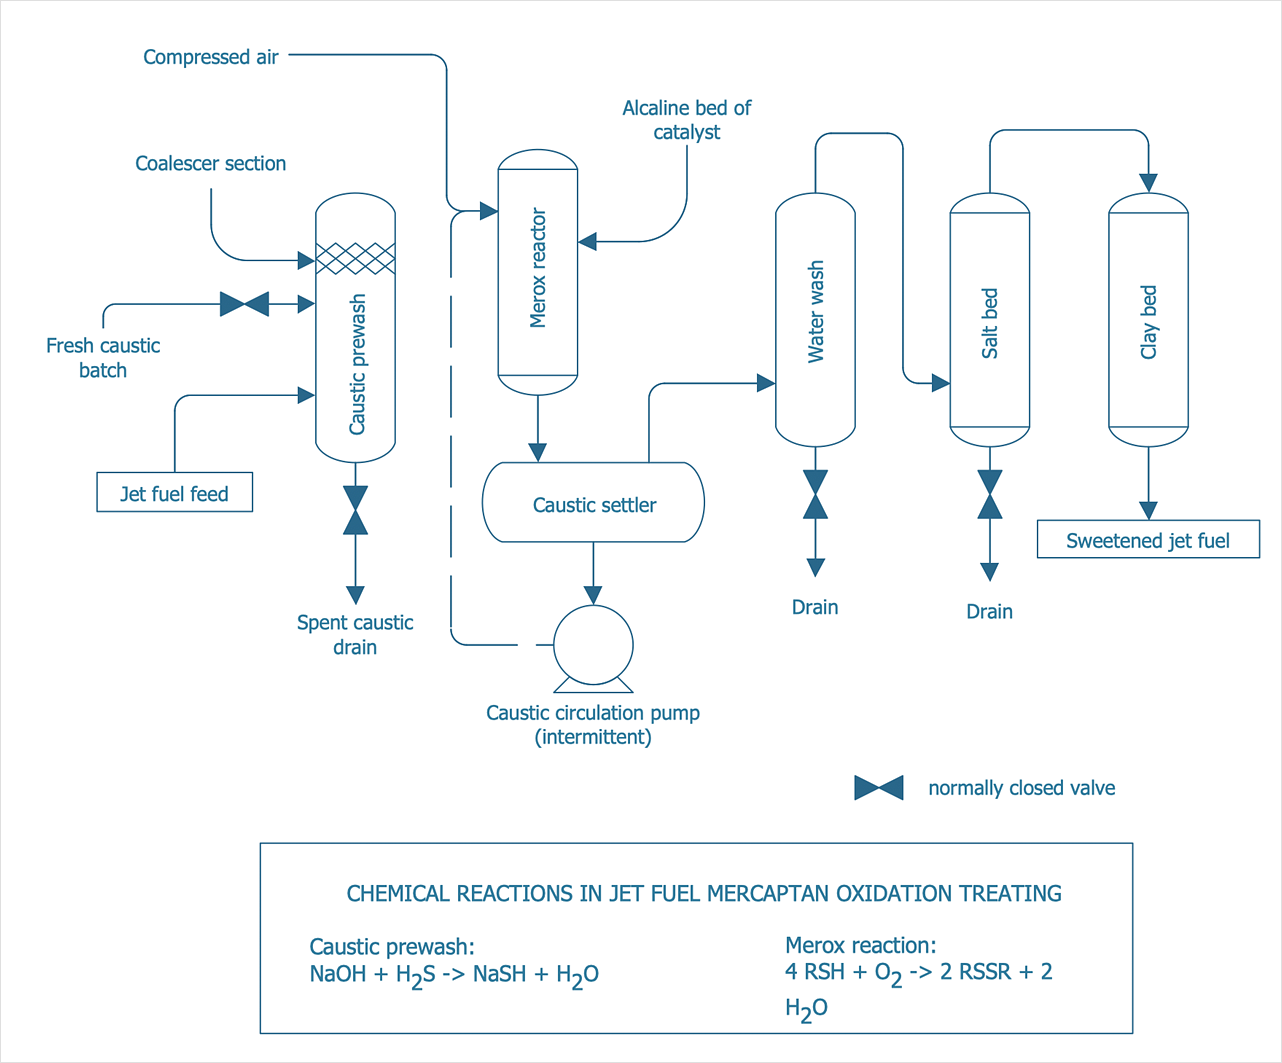
How to Draw a Chemical Process Flow Diagram
Process Flow Diagram widely used in modeling of processes in the chemical industry. A Chemical Process Flow diagram (PFD) is a specialized type of flowchart. With the help of Chemical Process Flow Diagram, engineers can easily specify the general scheme of the processes and chemical plant equipment. Chemical Process Flow Diagram displays the real scheme of the chemical process, the relationship between the equipment and the technical characteristics of the process. Chemical Process Flow Diagram illustrates the connections between the basic equipment as well as the overall structure of pipelines and other supporting equipment. The purpose of the PFD is to build the image of the basic idea of the chemical process. ConceptDraw DIAGRAM together with its Chemical and Process Engineering solution delivers the possibility to design Chemical Process Flow diagrams. It is designed for chemical industry engineers and designers.
 Cross-Functional Flowcharts
Cross-functional flowcharts are powerful and useful tool for visualizing and analyzing complex business processes which requires involvement of multiple people, teams or even departments. They let clearly represent a sequence of the process steps, the order of operations, relationships between processes and responsible functional units (such as departments or positions).
- Algorithm Flowchart Tutorial
- Basic Flowchart Symbols and Meaning | Solving quadratic equation ...
- Basic Flowchart Symbols and Meaning | Cross-Functional Flowchart ...
- Solving quadratic equation algorithm - Flowchart | Flow Chart ...
- Basic Flowchart Symbols and Meaning | Euclidean algorithm ...
- Types of Flowcharts | Make Physics Practical Flowchart And Algorithm
- Top 5 Android Flow Chart Apps | Solving quadratic equation ...
- Basic Flowchart Symbols and Meaning | Cross-Functional ...
- Basic Flowchart Symbols and Meaning | Process Flowchart | UML ...
- Tutorials On How To Use Flowchart To Solve Quadratic ...
- Solving quadratic equation algorithm - Flowchart | Software ...
- Basic Flowchart Symbols and Meaning | Top 5 Android Flow Chart ...
- Basic Flowchart Symbols and Meaning | Contoh Flowchart | Solving ...
- Basic Flowchart Symbols and Meaning | Flowchart | Process ...
- Example Of Logic Circuit Algorithm And Flowchart
- Swim Lane Flowchart Symbols | Cross-Functional Flowchart (Swim ...
- Workflow Diagram Software Mac | Bio Flowchart | UML Class ...
- Solving quadratic equation algorithm - Flowchart | Horizontal ...
- Types of Flowcharts | Basic Flowchart Symbols and Meaning | Fault ...
- Gane Sarson Diagram | Yed Flowchart Tutorial
- ERD | Entity Relationship Diagrams, ERD Software for Mac and Win
- Flowchart | Basic Flowchart Symbols and Meaning
- Flowchart | Flowchart Design - Symbols, Shapes, Stencils and Icons
- Flowchart | Flow Chart Symbols
- Electrical | Electrical Drawing - Wiring and Circuits Schematics
- Flowchart | Common Flowchart Symbols
- Flowchart | Common Flowchart Symbols


