UML State Machine Diagram.Design Elements
UML State Machine Diagram is a type of Behavior Diagrams that displays the finite state machine with states and state transitions.
UML State Machine Diagram is a realization of the mathematical concept of a finite state machine. State Machine Diagram is an oriented graph for finite state machine in what tops represent states and connectors show transitions between two states. States are represented as rounded rectangles and state transitions as arrows. The Initial State of the system is represented as black circle, and Final State as encircled black circle.
UML State Machine Diagram is the object-based version of Harel State Chart that is extended by UML. UML State Machines keep the main benefits of traditional finite state machines and also overcome their restrictions. UML State Machines extend the notion of actions.
The Rapid UML Solution for ConceptDraw DIAGRAM contains 13 vector stencils libraries with 393 interactive shapes that you can use to design your UML diagrams.
To design a State Machine Diagram use the UML State Machine Diagram library.
UML State Machine Diagram library contains 35 shapes:
- Send signal state
- Frame, Fragment
- Entry point
- History pseudostate
- Junction pseudostate
- Choice pseudostate
- Note
- Simple state
- State with compartments
- Composite state
- Transition text
- Transition
- Final state
- Terminate pseudostate
- Exit point
- Vertical fork/join pseudostate
- Horizontal fork/join pseudostate
- Composite state (with substates)
- Initial state
- Internal behavior
- Self-transition 1
- Self-transition 2
- Sub-machine diagram
- Receive signal state
- Composite state
- Subactivity state
- Divider
- Synch state
- Connector
- Text label
- Composite state
- Composite state (2 concurrent substates)
- Composite state (2 substates)
- Entry point connector
- Connector opposite
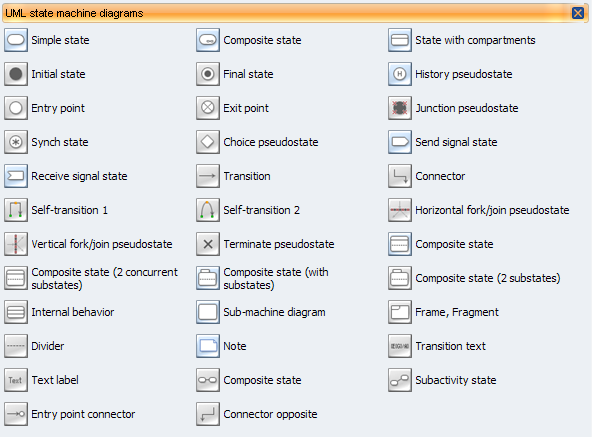
Pic.1. UML State Machine Diagram Library

Pic.2. UML State Machine Diagram Library Elements
ConceptDraw Rapid UML solution provides UML State Machine Diagram library of vector stencils for drawing the state machine diagrams using state machine blocks and assembly connectors.

Pic.3. UML State Machine Diagram (Mac OS X, Windows)
Use design element from the UML State Machine Diagram library to draw your own UML state machine diagrams of complex systems and software applications.
All libraries for creating UML diagrams are available inside the ConceptDraw DIAGRAM Templates and samples are located in the Rapid UML section of ConceptDraw STORE.


Pic.4. UML State Machine Solution in ConceptDraw STORE and UML State Machine template
The UML Diagrams produced with ConceptDraw DIAGRAM are vector graphic documents and are available for reviewing, modifying, and converting to a variety of formats (image, HTML, PDF file, MS PowerPoint Presentation, Adobe Flash or MS Visio).
TEN RELATED HOW TO's:
There are a lot of structured analysis and design technique methodologies used to describe systems and data sources. To visualize data structures, data flow diagrams can be used for various purposes in the area of software engineering. Nowadays these diagrams are also used in the area of business analysis and information system analysis.
This data flow diagram depicts an account processing system of a typical account department of a small manufacturing enterprise. It shows the data transmission through the order processing to shipping verification. This data flow diagram was created according to standard of Yourdon and Coad notation. The vector graphic objects of Yourdon/Coad notation symbols was delivered by ConceptDraw Data Flow Diagrams solution. The current DFD can be employed as an example of a business process model, representing the set of business events and interactions commonly engaged in a accounts receivable process.
Picture: Data Flow Diagrams
Related Solution:
ConceptDraw Note Exchange Solution permits users to develop and organize notes and tasks in ConceptDraw MINDMAP. Your work can be accessed later, just with one click, regardless of preferred platform.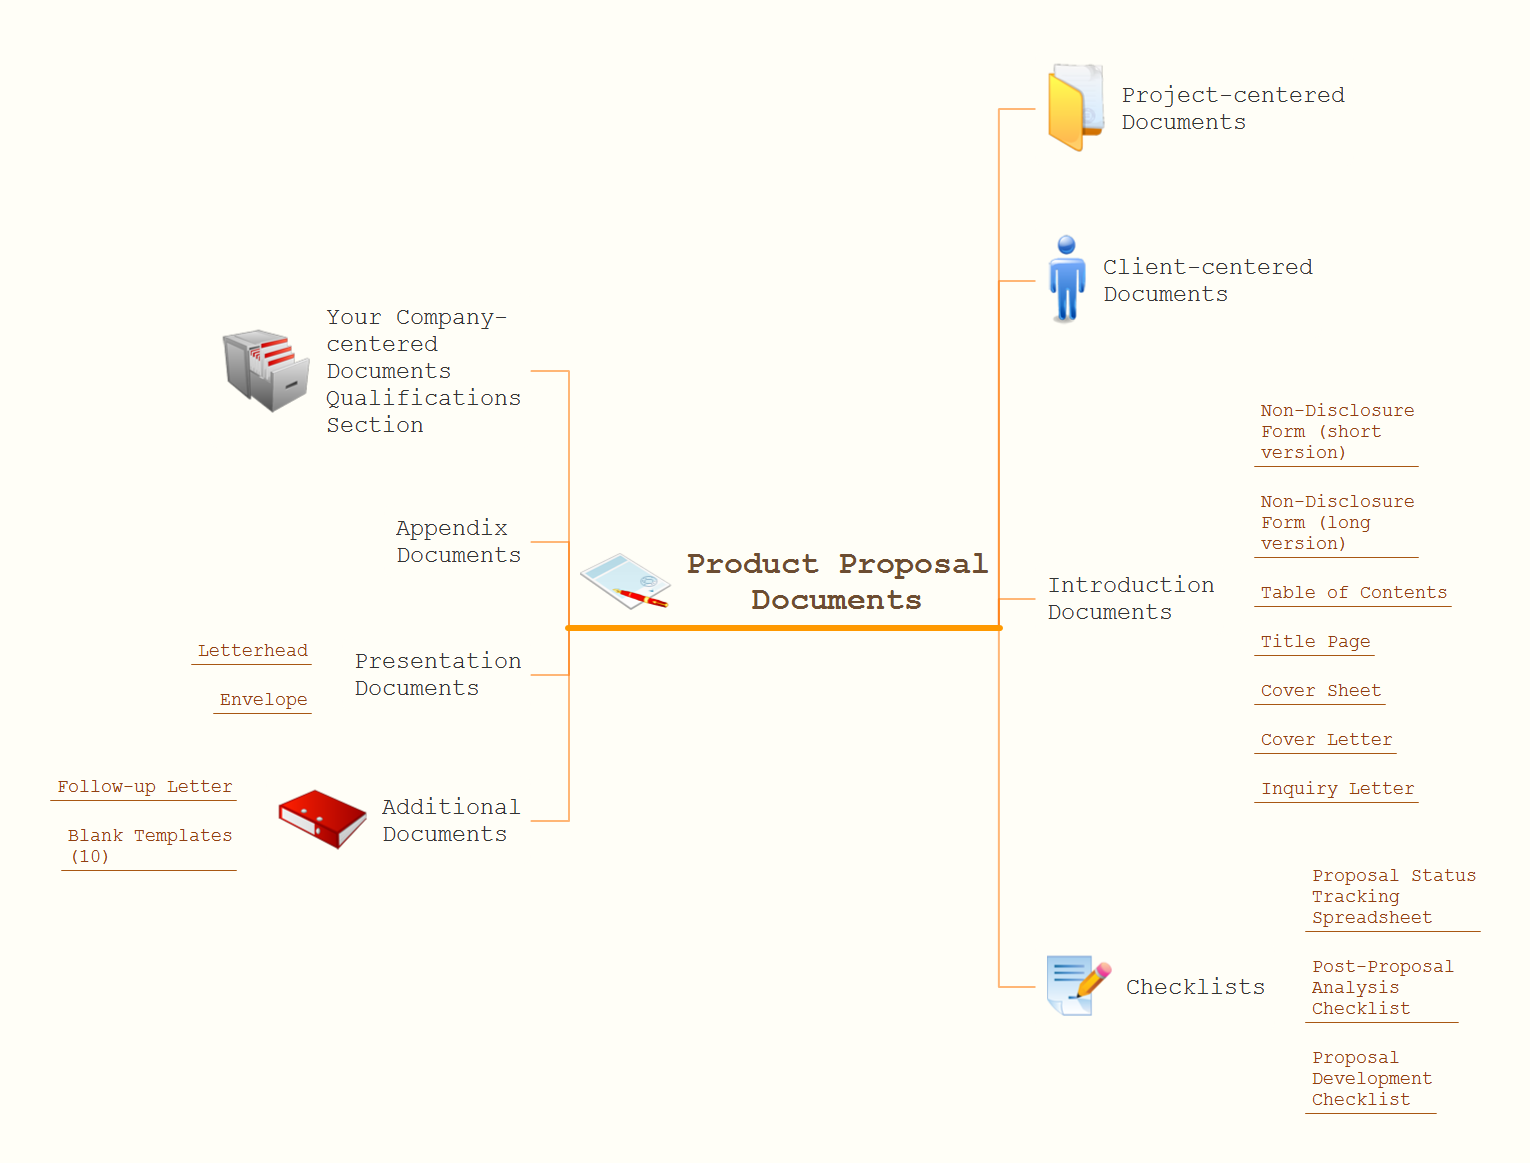
Picture: Detail Specifications Exchanging Mind Maps with Evernote
Related Solution:
You want design the map of Australia, maps of Australia states or surround islands, maps of Australia self governing mainland territories or extra external territories? Use the indispensable ConceptDraw DIAGRAM diagramming and vector drawing software extended with unique Australia Map Solution from the Maps Area of ConceptDraw Solution Park.
Picture: Map of Australia
Related Solution:
Modular function deployment, same as the decision-matrix method, can be used within the quality function deployment activity, but one of the most popular methods nowadays is the so-called “House of Quality” (HOQ).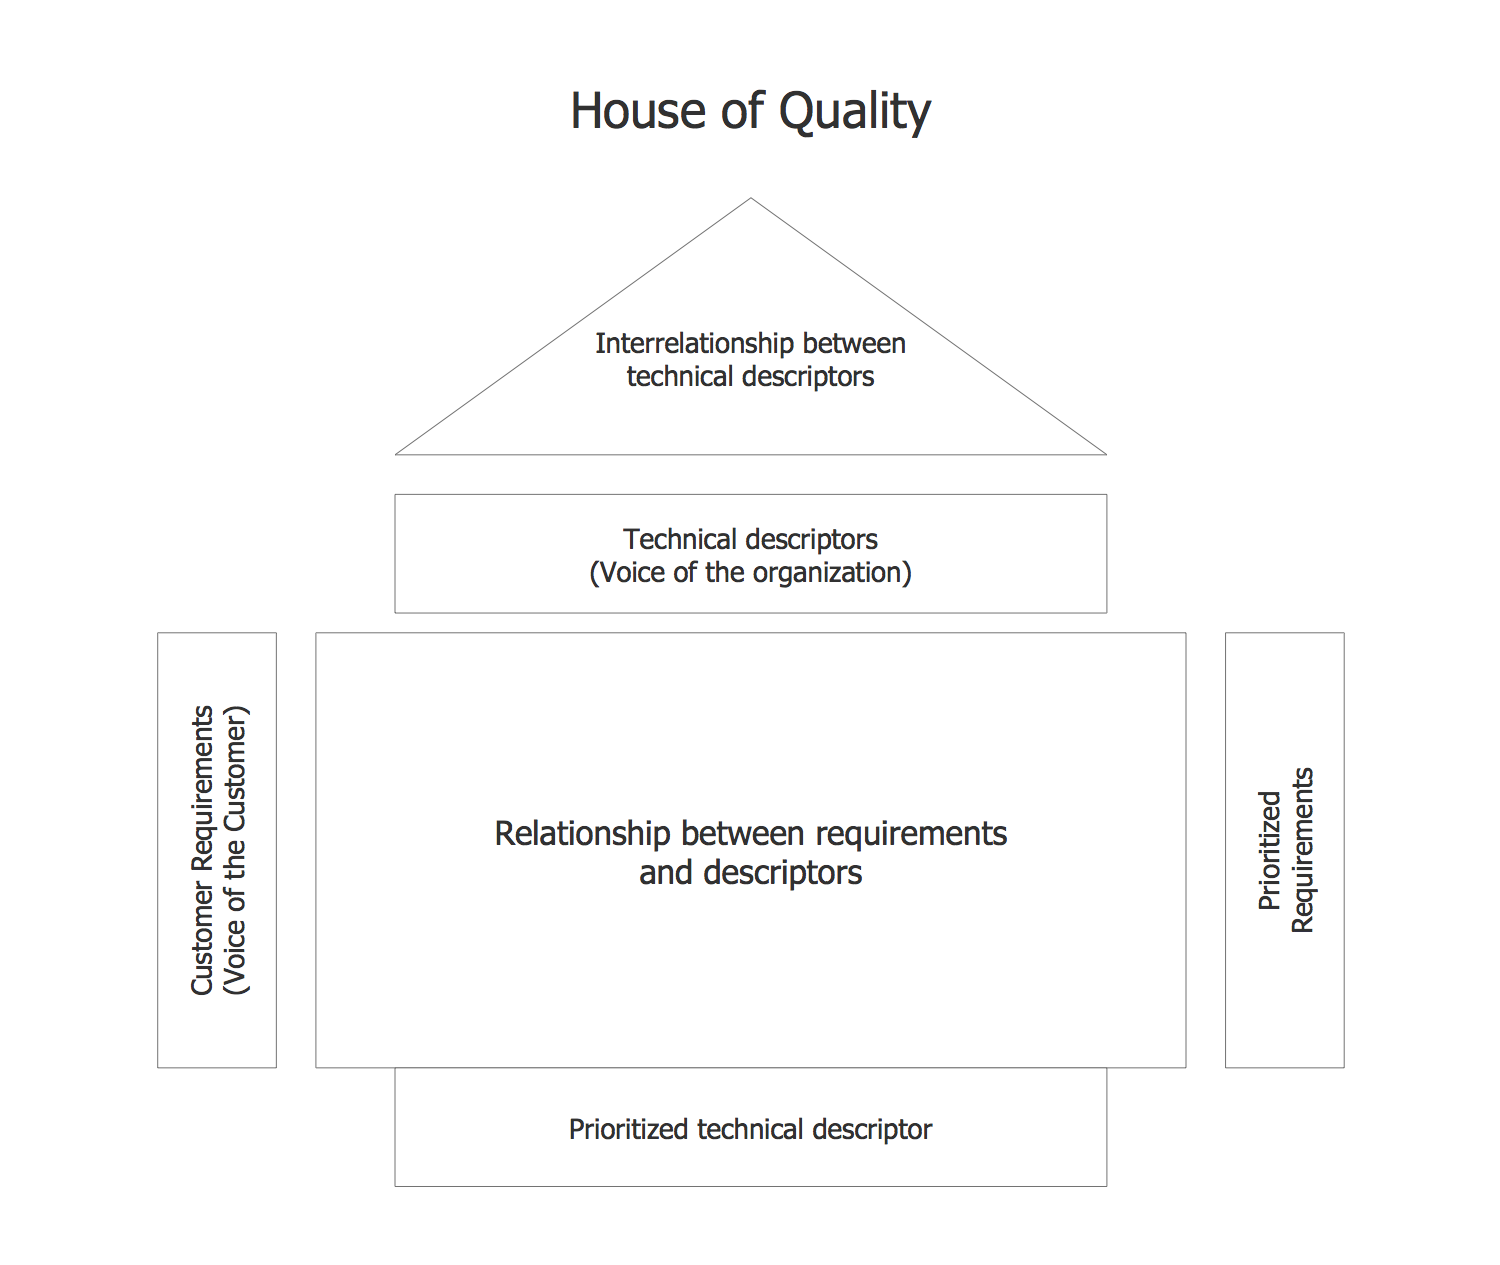
Picture: HOQ
Related Solution:
In software engineering, a UML Class Diagrams is a type of static structure diagram that is used both for general conceptual modeling of the systematics of the application, and for detailed modeling translating the models into programming code.
Use ConceptDraw DIAGRAM with UML class diagram templates, samples and stencil library from Rapid UML solution to show the classes of system, their attributes, operations or methods, and the relationships among the classes.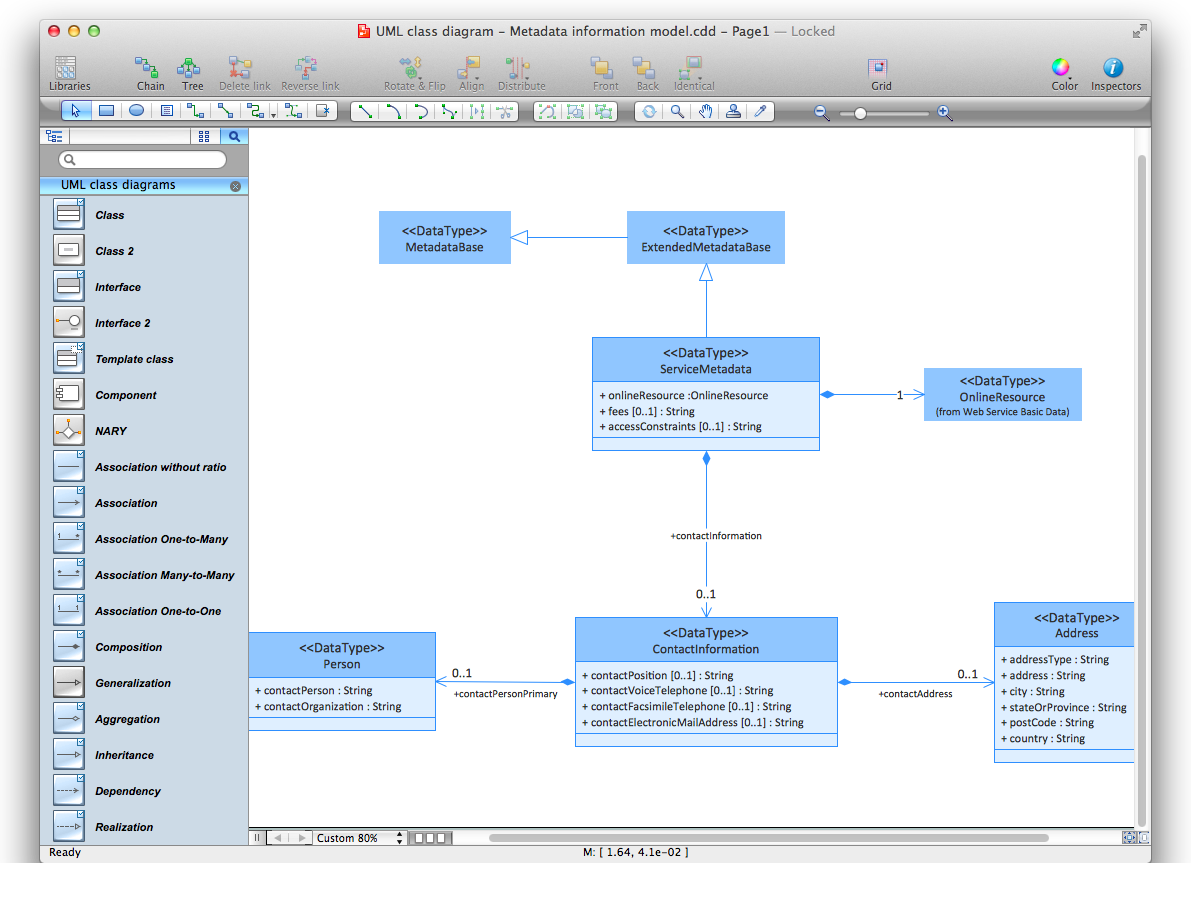
Picture: UML Class Diagrams. ConceptDraw DIAGRAM - Diagramming Software for Design UML Diagrams
Related Solution:
Create bar charts for event management problem solving and visual data comparison using the ConceptDraw DIAGRAM diagramming and vector drawing software extended with the Bar Graphs Solution from the Graphs and Charts area of ConceptDraw Solition Park.
Picture: Bar Diagrams for Problem Solving.Create event management bar charts with Bar Graphs Solution
Related Solution:
ConceptDraw has 142 vector stencils in the 8 libraries that helps you to start using software for designing own Business Process Diagrams. Use Swimlanes library with 20 objects from BPMN.
Picture: Business Process Elements: Swimlanes
Related Solution:
UML Class Diagrams is a type of static structure diagram that is used both for general conceptual modeling of the systematics of the application, and for detailed modeling translating the models into programming code. It describes the structure of a system by showing the: classes of a system, attributes, operations, and the relationships between them.
The Rapid UML Solution for ConceptDraw DIAGRAM includes the UML Class Diagram library that helps you to design the UML Class Diagram quick and easy. You can simply and quickly drop the ready-to-use objects from the library into your document to create the UML Class Diagram.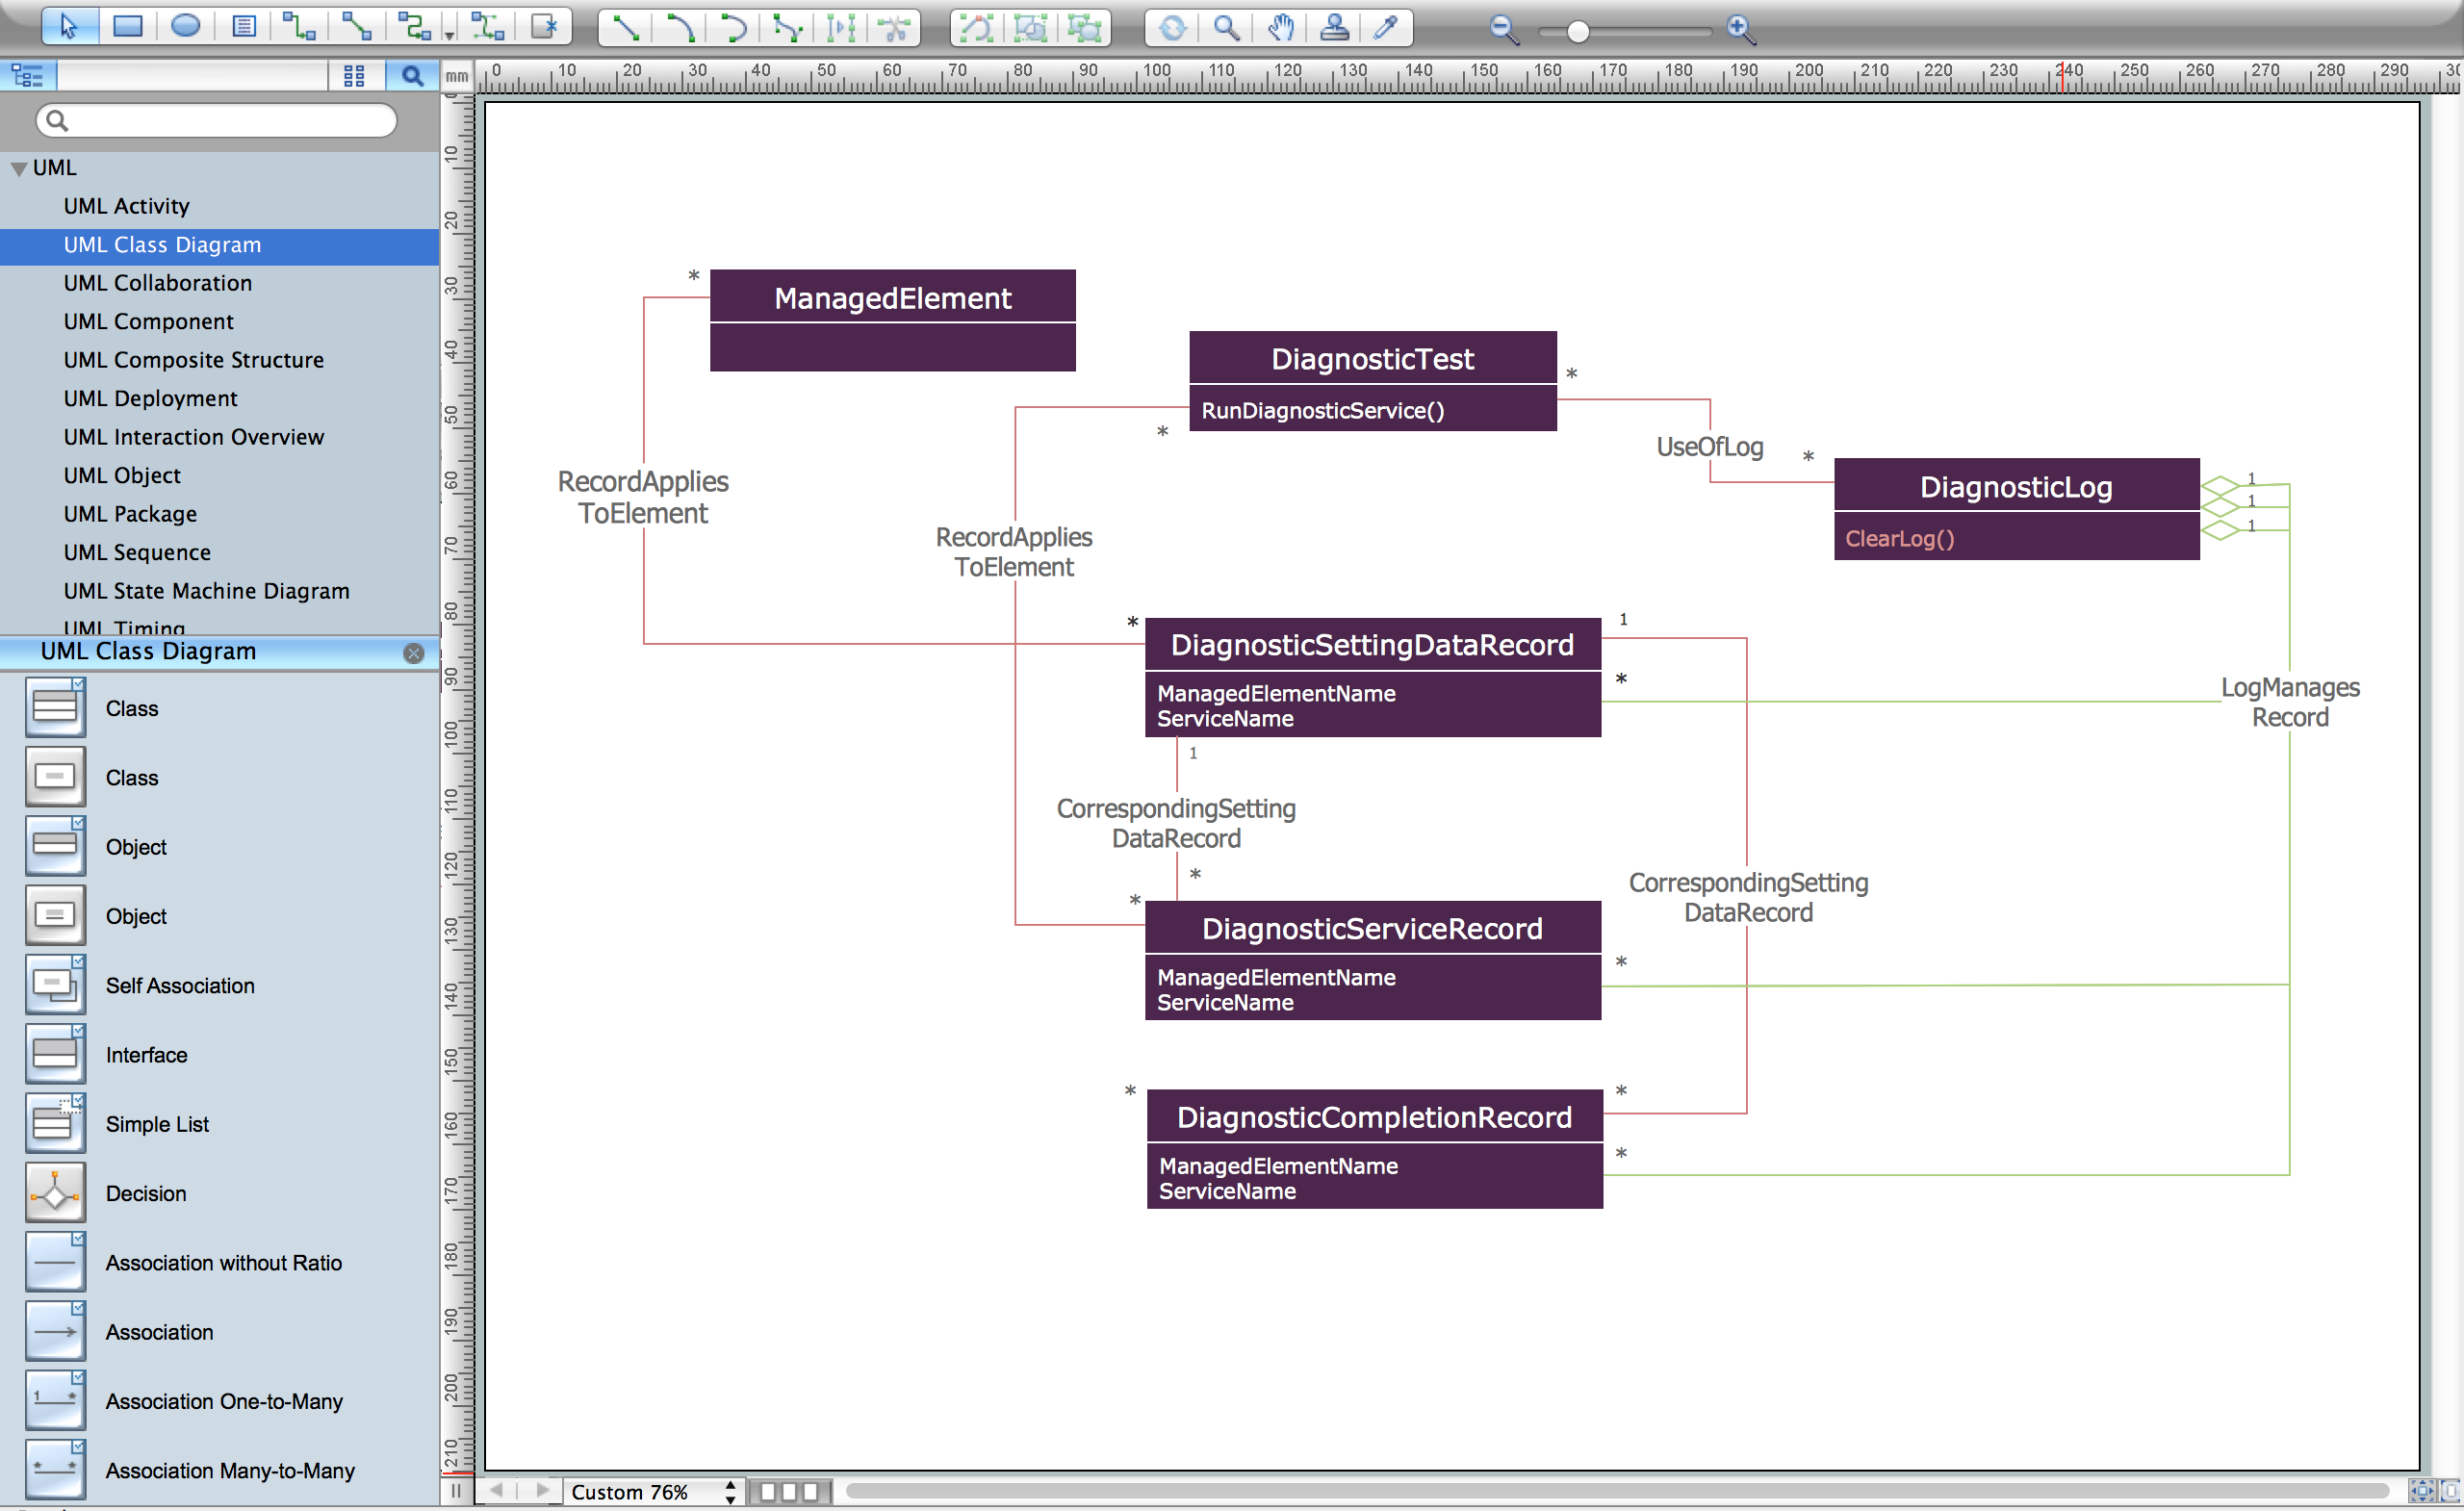
Picture: UML Class Diagram Constructor
Related Solution:


