Swim Lanes Flowchart.
Flowchart Examples
This sample was created in ConceptDraw DIAGRAM diagramming and vector drawing software using the Cross-Functional Flowcharts solution from the Business Processes area of ConceptDraw Solution Park.

Example 1. Swim Lanes Flowchart. Identification and logging
This example was redesigned from the Wikimedia Commons file [commons.wikimedia.org]
This sample shows the Swim Lanes Flowchart of Identification and logging. A swim lane is a visual element of the flowchart that detaches the subprocesses of a business process, so the processes and decisions are visually grouped between the swim lanes. The swim lanes represent the responsibilities for the subprocesses and also the delays and mistakes that can occur. The swim lanes can be arranged vertically or horizontally as in our example. The shapes represent the subprocesses and the arrows represent how the information is passed between them.
Using the ready-to-use predesigned objects, samples and templates from the Cross-Functional Flowcharts Solution for ConceptDraw DIAGRAM you can create your own professional looking Cross-Functional Flowcharts of any complexity quick and easy.
The Flowcharts produced with ConceptDraw DIAGRAM are vector graphic documents and are available for reviewing, modifying, and converting to a variety of formats (image, HTML, PDF file, MS PowerPoint Presentation, Adobe Flash or MS Visio).
See also Samples:
NINE RELATED HOW TO's:
Process Flow Chart is a visual diagram which shows the processes and relationships between the major components in a system, and uses for this the special process flow chart symbols: special shapes to represent different types of actions and process steps, lines and arrows to represent relationships and sequence of steps. It often named process flow diagram, it use colored flowchart symbols.
It is incredibly convenient to use the ConceptDraw DIAGRAM software extended with Flowcharts Solution from the "Diagrams" Area of ConceptDraw Solution Park for designing professional looking Process Flow Charts.
Picture: Process Flow Chart Symbols
Related Solution:
The Event - driven Process Chain ( EPC ) allows managers visually present business process models for making decisions for business processes improvement.
Event-Driven Process Сhain Diagrams for improvement throughout an organisation.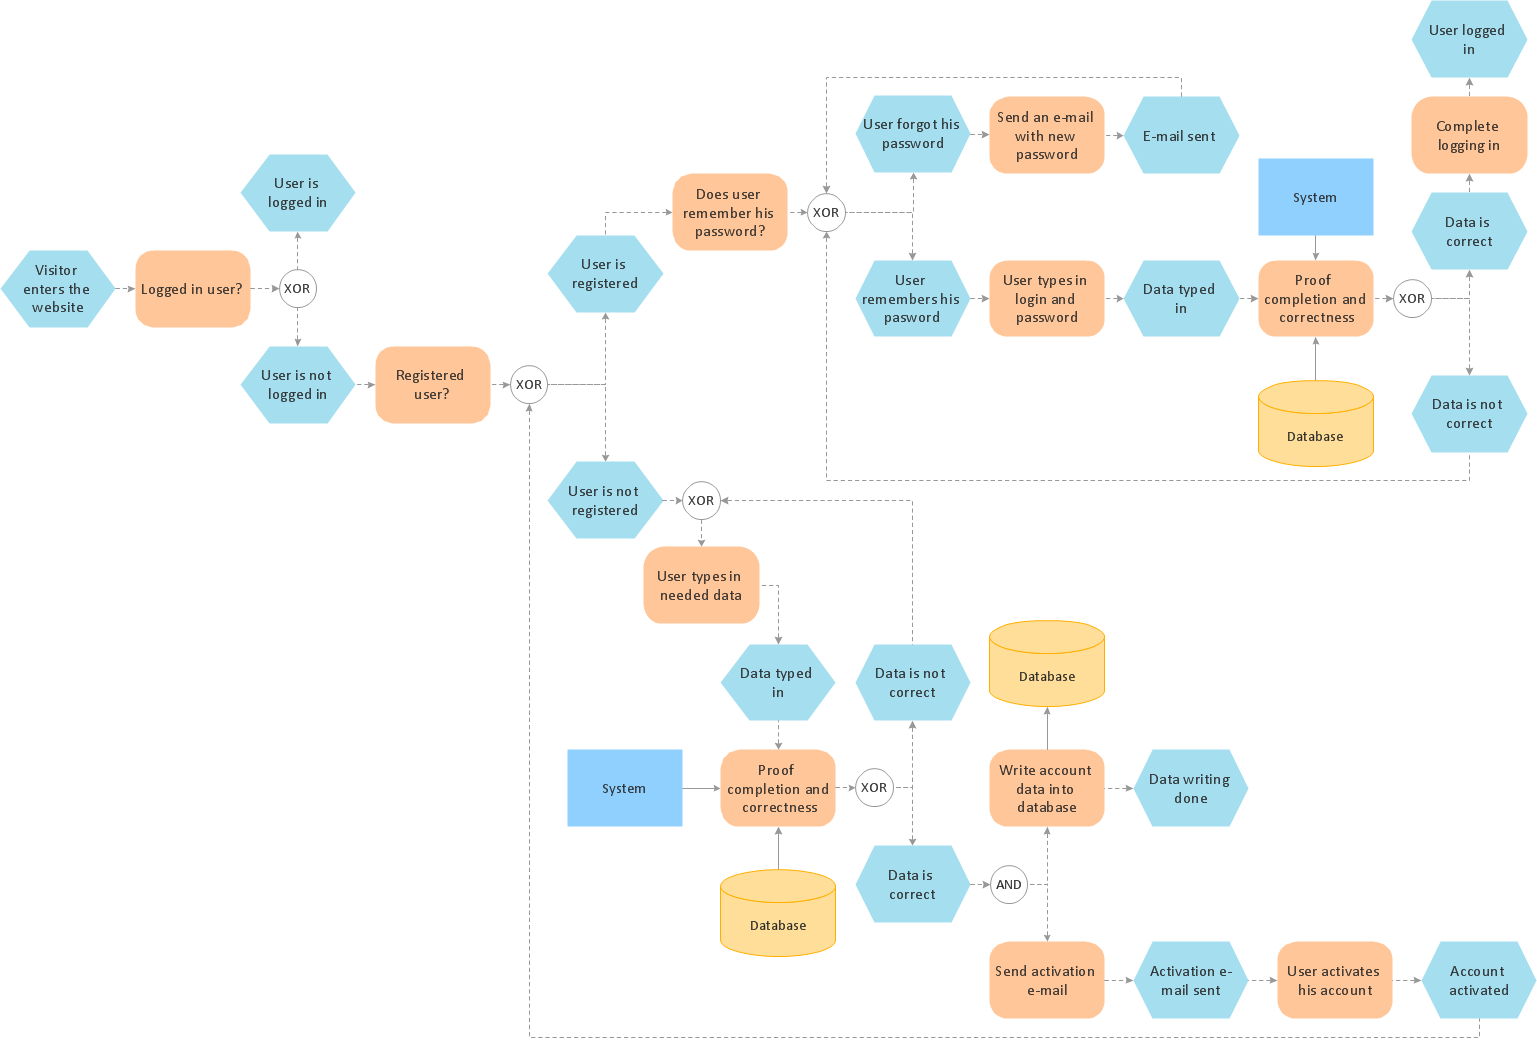
Picture: EPC (Event-driven Process Chain) Flowcharts
Related Solution:
You need to draw the Circular Arrows Diagram, Segmented Diagram or Circular Flow Diagram? Any of these diagrams can be fast and easy designed in ConceptDraw DIAGRAM software, which offers the Business Diagrams Solution from the Management Area with extensive drawing tools, predesigned samples and circular flow diagram template. The use of ready template is the easiest way of drawing.
Picture: Circular Flow Diagram Template
Related Solution:
ConceptDraw DIAGRAM diagramming and vector drawing software extended with Area Charts solution from the Graphs and Charts area of ConceptDraw Solution Park is the best for drawing the Area Charts simply and fast.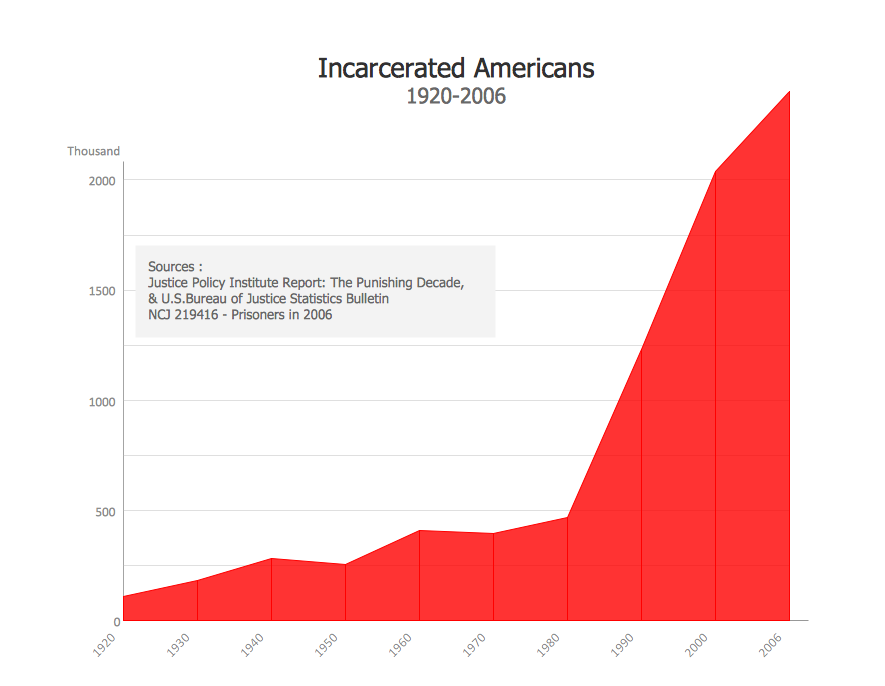
Picture: Area Charts
Related Solution:
ConceptDraw DIAGRAM is workflow diagram software enhanced by numerous extentions from ConceptDraw Solution Park. It inludes many professional workflow diagrams, examples and ready to use workflow diagram and workflow symbols. Workflow symbol collections include symbols for Processes, Planning, Scheduling, Flow Control, In-Transit Process Visibility.
The best workflow diagram software you may find is ConceptDraw DIAGRAM. ConceptDraw DIAGRAM is world-known diagramming software that works for both Windows and Mac OS X platforms. The software contains complete set of features allows to draw diagrams faster. ConceptDraw DIAGRAM extended with the Workflow Diagram solution provides additional libraries, templates and samples for drawing professional workflow diagrams.
Picture: Workflow Diagram Software
Related Solution:
A pie chart or a circle graph is a circular chart divided into sectors, illustrating numerical proportion. In a pie chart, the arc length of each sector and consequently its central angle and area, is proportional to the quantity it represents.
Pie chart examples and templates created using ConceptDraw DIAGRAM software helps you get closer with pie charts and find pie chart examples suite your needs.
Picture: Pie Chart Examples and Templates
Related Solution:
Accounting is a cornerstone of any business, it’s basement. If you want to have a visual representation of your finance management, use audit flowchart symbols to document the money flow. Although some would say that accounting is boring, it is very a responsible duty.
The audit flowchart symbols is supplied with ConceptDraw Audit Flowcharts solution as a vector objects library. Together with Conceptdraw Drawing capabilities it forms the helpful tool for audit process planning and setting the steps of audit by designing audit flow charts. Audit Flow charts are used to organize fiscal information tracking process as well as in accounting, finance and investment management.
Picture: Audit Flowchart Symbols
Related Solution:
How do Fishbone diagrams solve manufacturing problems? Fishbone diagrams are successfully used in various fields of industries and manufacturing to analyze the set of possible causes and their effects. Fishbone diagram provides a process to clearly define the “Effect” and then puts you to thinking about the possible causes, based on the categories of common problems in manufacturing.
ConceptDraw DIAGRAM application extended with Fishbone Diagrams solution lets you construct Fishbone diagrams and represent globally recognized standards for manufacturing 6 Ms and 8 Ms.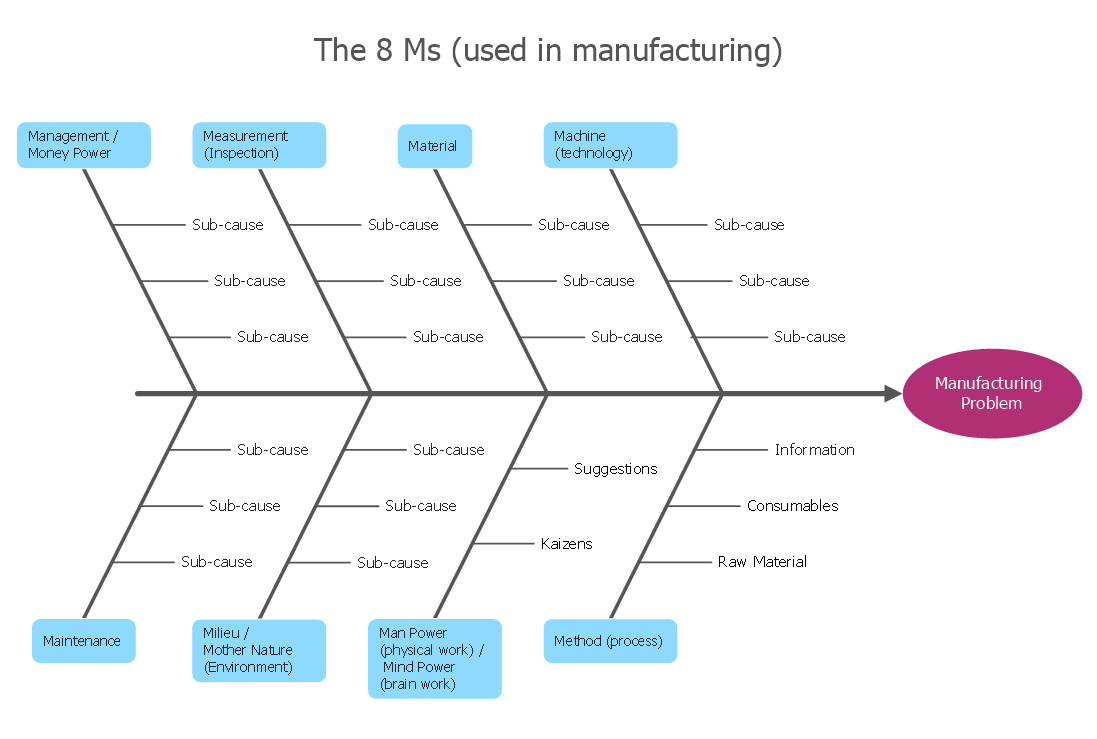
Picture: How Do Fishbone Diagrams Solve Manufacturing Problems
Related Solution: