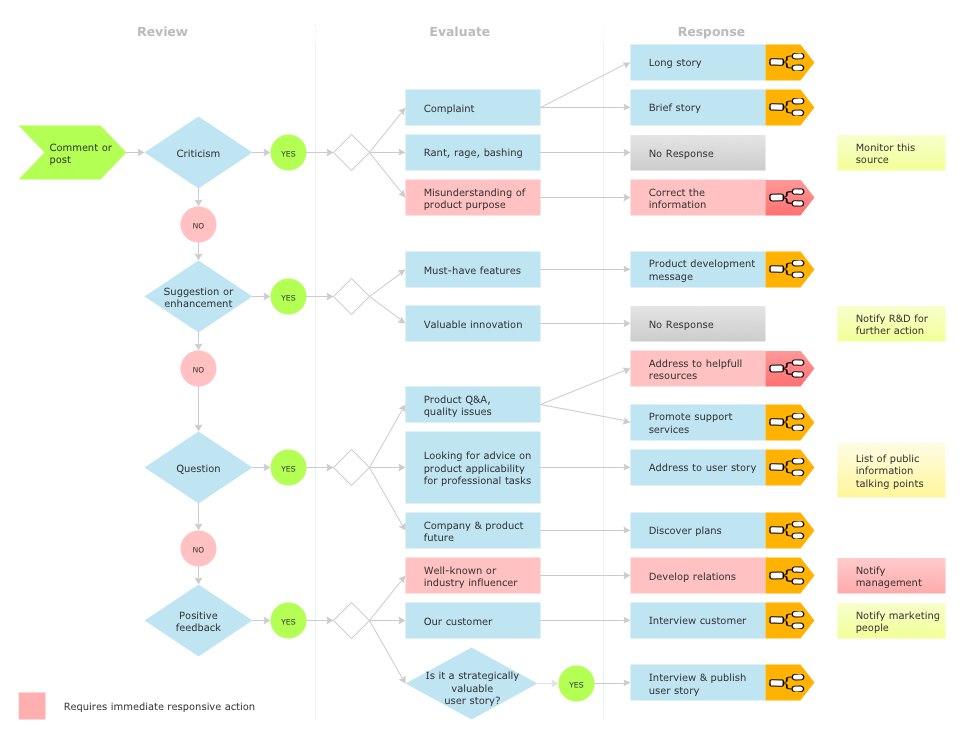
Pie Chart Examples and Templates
Whatever needs to be compared, it can be done with help of charts, such as a pie chart. Pie chart is a very widely used type of chart which illustrates its sectors in the different proportions with different angles. This type of chart is very useful for illustrating some kind of data, divided by the groups. The way this data is represented is very convenient as it is obvious to tell if one sector is bigger than another by only looking at the pie chart and its sectors. Shortly, pie chart looks like a disk, which is divided by different sectors. Each sector displays its own numerical proportion. Each sector is situated by an angle, which is proportional to the total quantity, which always equals 100%. The pie chart was named this way because of its resemblance to a sliced pie which effectively displays the proportions of its constituents. The pie chart allows everyone to emphasize the value of each part of the total amount illustrated on this chart.
There are different types of pie chart you can make if you need to. There are pie charts with its sectors located at a short distance one from another or joined. Sometimes some pie chart has a hole in the very centre of it, then it’s called a donut chart. If you use a bright colour palette for creating your pie chart, then there are more chances for those who this chart is being made to see and to recognize which of the sectors is what and if one bigger than another. If you add a legend to your chart, it will increase your chances for having the final result effective, so it will lead to what it was planned to lead to, as both having it coloured with a legend increases the understanding of the data which is being illustrated.
Pie charts are very widely used in business and statistics. They are meant to be explaining some particular data and, sometimes, the work results. They are also often used in mass media to compare the existing facts and other information which is described in the main articles on the news sites, etc. This kind of charts is simply for visualizing the percentage of the parts of one total unit and it is very widely used in very many fields of activity.
In case you want to create such pie chart or pie charts, then you can make it using the appropriate software as creating all of the sectors one by one, colouring them, etc, is always better when you have existing examples to look at and to replicate.
There is one good application we can recommend, which is, obviously, ConceptDraw DIAGRAM as it is one of the best tools existing for making any kind of chart, flowchart, diagram, plan or scheme. This software was developed by the team of specialists in IT from CS Odessa.
ConceptDraw DIAGRAM software is famous for its solutions which can be found in ConceptDraw STORE – another product of CS Odessa which can be used additionally to ConceptDraw DIAGRAM Having these very useful applications as well as needed solutions can simplify your work in making different flowcharts, plans, schemes, diagrams and charts, including the pie chart. One of popular solutions is a Pie Chart solution which can be used while working in ConceptDraw DIAGRAM application. This solution offers very many different powerful tools for drawing the needed charts and it provides its users with different templates, samples and one library full of vector stencils which can be used for creating the pie charts, donut chart and pie graph worksheets.
ConceptDraw DIAGRAM software is a very useful thing itself and together with its solution can be even more useful. Having it, you can always draw any needed Pie Chart, Exploded Pie Chart, Percentage Pie Chart, Donut Chart, Arrow Ring Chart, Donut Chart Template and many other charts. Also you can always Free Download Pie Chart Software and View All Examples using this site.
In the end of the process of drawing your own chart, which can be simply created with help of the previously made examples of already existing pie charts, you will get truly unique and professionally looking pie chart which will be the one looking very smart as if you spent lots of long hours making it or even days. But the fact is that having the appropriate solution eliminates your need for making everything from a scratch and it means that you can save lots of time by simply using what was already made as your draft, only changing the data, converting it to your own which has to be illustrated.
The solution as well as the software itself is quite a unique thing to have. There are not as many applications which are extended with examples, at least not as professional and convenient. In case you want to make something very special so it looks very smart, professional and good, then you have to, first of all, download ConceptDraw DIAGRAM software, download the needed solution (Pie Chart solution if you want to create a pie chart) and to choose any needed and admired example from it to convert into your own drawing.
Once you try to use this great and smart, sophisticated and very convenient software, you will get used to it very soon having our support team helping you with all of the issues needed to be solved, and you will be very soon able to create not only a pie chart, but any other chart, using different solutions, and so the stencil libraries and examples as working in some business structure you may need to make not only pie charts, but so many more other drawings, which can be always created in ConceptDraw DIAGRAM only within a couple of hours or even a couple of minutes.
Download this software today to make sure you do the right thing as once you get it for yourself, you will be surprised how useful and helpful it is as well as ready to recommend it to some other people you know: your business partners, colleagues, employees and clients.
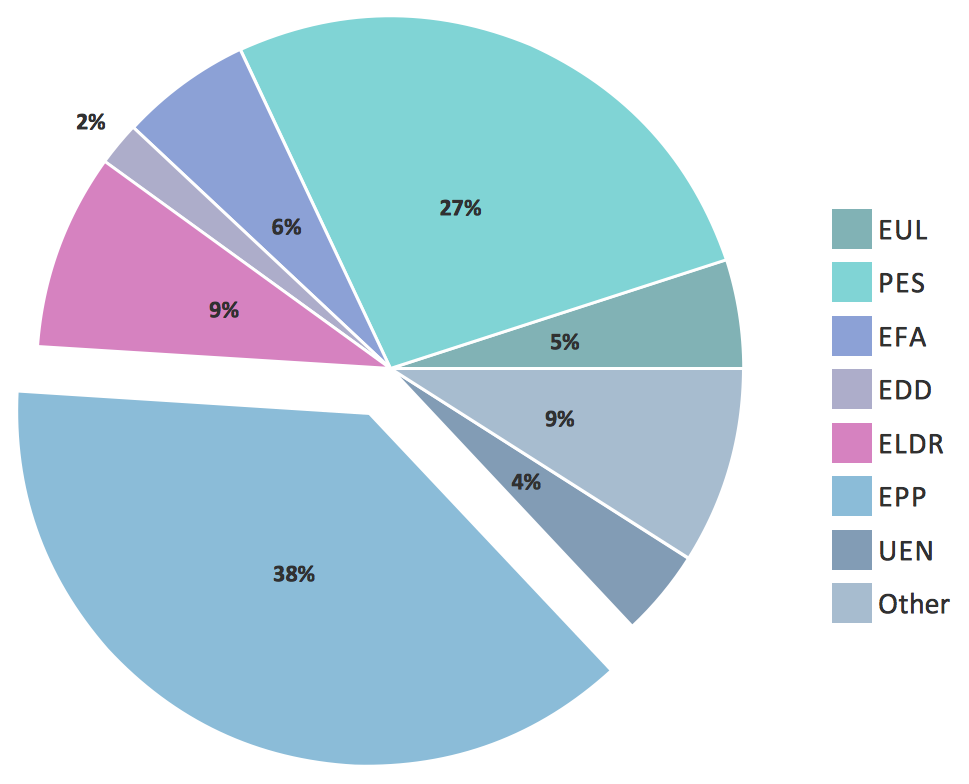
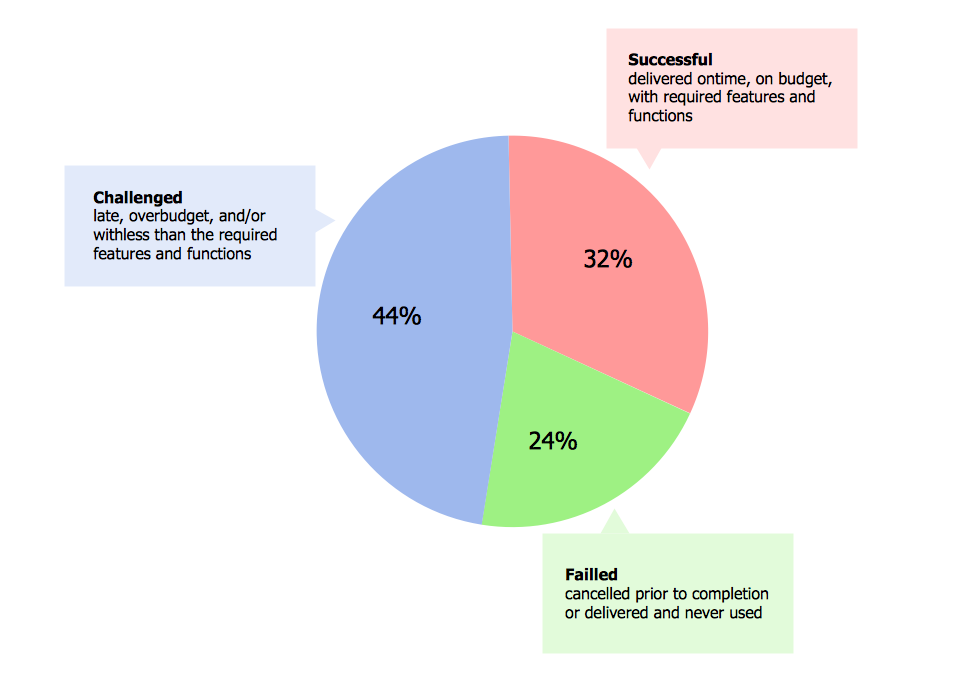
These pie and donut chart examples was designed using ConceptDraw DIAGRAM diagramming and vector drawing software extended with Pie Charts solution from Graphs and Charts area of ConceptDraw Solution Park.

Example 1. Pie Charts Solution
All these pie and donut chart samples are included in the Pie Charts solution.
You can quickly rework these examples into your own charts by simply changing displayed data, title and legend texts.
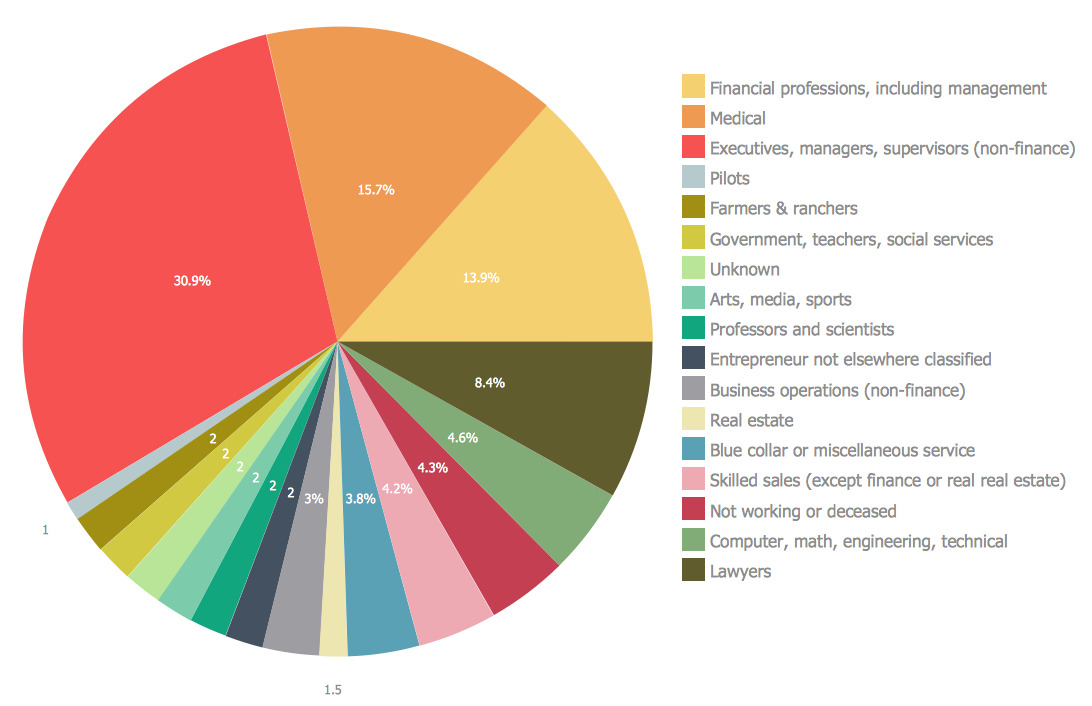
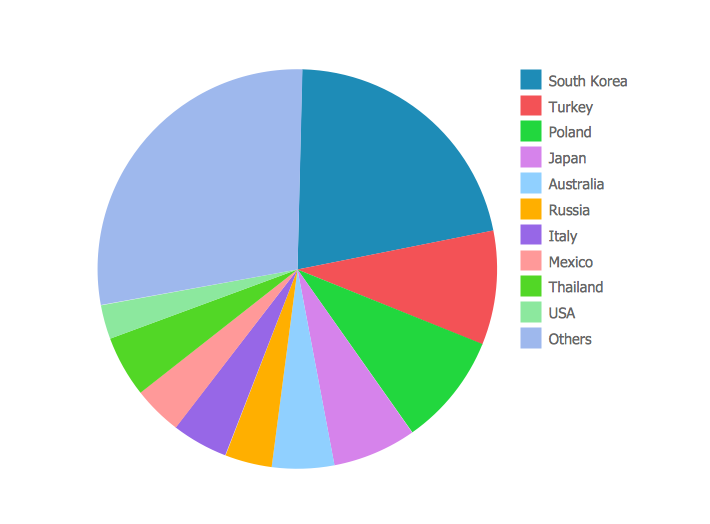
 Pie Chart
 Exploded Pie Chart
 Percentage Pie Chart
 Donut Chart
 Percentage Pie Chart
 Donut Chart Template
 Pie Chart
 Pie Chart