How to Draw ER Diagrams
How to Draw ER Diagrams? ConceptDraw DIAGRAM diagramming and vector drawing software gives the ability to describe a database using the ERD drawings and ER Diagrams. Entity Relationship diagram depicts database by abstract way.
Entity-Relationship Diagram (ERD) solution from the Software Development Area for ConceptDraw Solution Park includes 45 predesigned icons advocated by popular Chen's and Crow’s Foot notations that can be used when describing an enterprise database.

Sample 1. How to Draw ER Diagrams
The easiest and fastest way of drawing ER diagrams is to design them on the base of ready-to-use Chen ERD and Crow's Foot ERD templates. They both are represented at ConceptDraw STORE.

Example 2. ERD Templates
Use the corresponding template and other objects from the ERD Chen's Notation and ERD Crow's Foot Notation libraries to design your Entity-Relationship Diagram in a few minutes.

Example 3. Entity-Relationship Diagram, Crow's Foot Notation
Another way of easy drawing ER diagrams in ConceptDraw DIAGRAM is:
- create new ConceptDraw document,
- add required objects from the libraries,
- connect the objects with Smart Connector tool from the Home toolbar,
- use the Action menus of the objects to change diagram elements,
- apply Line, Fill, Shadow and Text tools to format diagram objects.

Example 4. Entity-Relationship Diagram, Chen's Notation
The ER Diagrams you see on this page were created in ConceptDraw DIAGRAM using the libraries from Entity-Relationship Diagram (ERD) solution. An experienced user spent 10-15 minutes creating each of these samples.
Use the Entity-Relationship Diagram (ERD) Solution for ConceptDraw DIAGRAM software to demonstrate how to draw ER Diagrams fast, easy and effective.
All source documents are vector graphic documents. They are available for reviewing, modifying, or converting to a variety of formats (PDF file, MS PowerPoint, MS Visio, and many other graphic formats) from the ConceptDraw STORE. The Entity-Relationship Diagram (ERD) Solution is available for all ConceptDraw DIAGRAM or later users.
NINE RELATED HOW TO's:
Use of various charts, diagrams and infographics is the most effective way of visual presenting information about healthy foods, healthy eating and healthy diet. ConceptDraw DIAGRAM diagramming and vector drawing software offers the Health Food solution from the Food and Beverage area of ConceptDraw Solution Park which is overfull of powerful drawing tools, libraries with ready-to-use vector objects and clipart, predesigned samples and examples which will help you easy design healthy foods illustrations.
Picture: Healthy Foods
Related Solution:
The ability to develop UML diagrams as quickly as the ideas come. The solution uses ConceptDraw RapidDraw techniques. The result is a vector graphic document.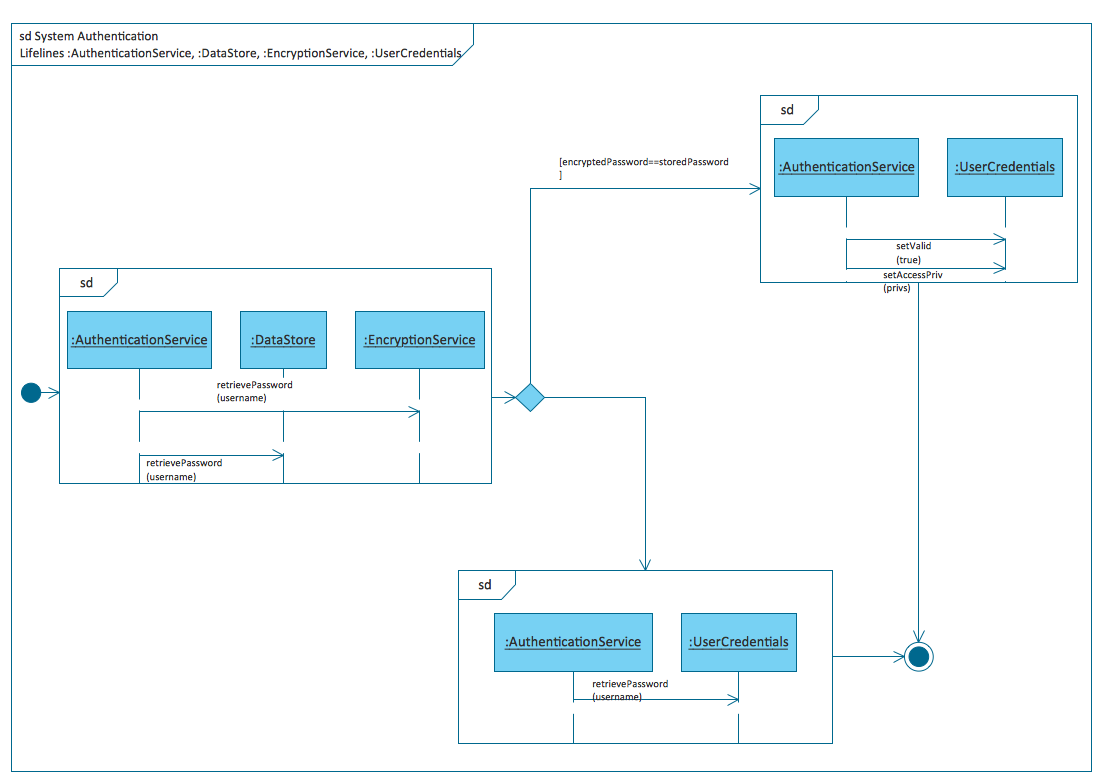
Picture: Introductory Guide to Rapid UML Solution
Related Solution:
The popularity of visual content marketing grows day by day. So now simple and convenient designing of professional looking Content Marketing Infographics becomes increasingly actual. For achievement this goal ConceptDraw DIAGRAM software offers the Marketing Infographics Solution from the Business Infographics Area.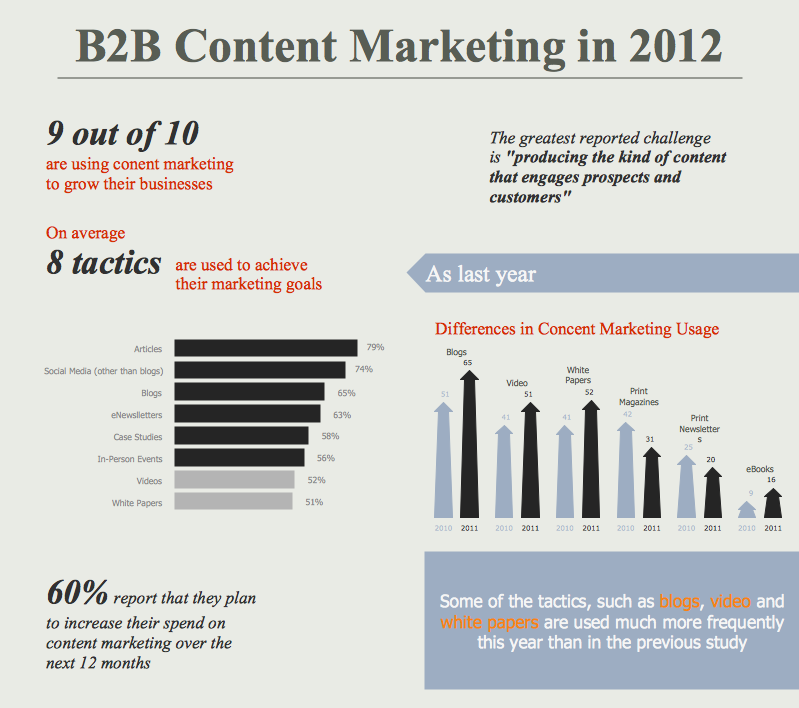
Picture: Content Marketing Infographics
Related Solution:
The vector stencils library Watercraft contains clipart of ships, boats, yachts, submarines for ConceptDraw DIAGRAM diagramming and vector drawing software.
Use it to draw illustrations of vessels and water transport over a sea, ocean, lake, canal, river.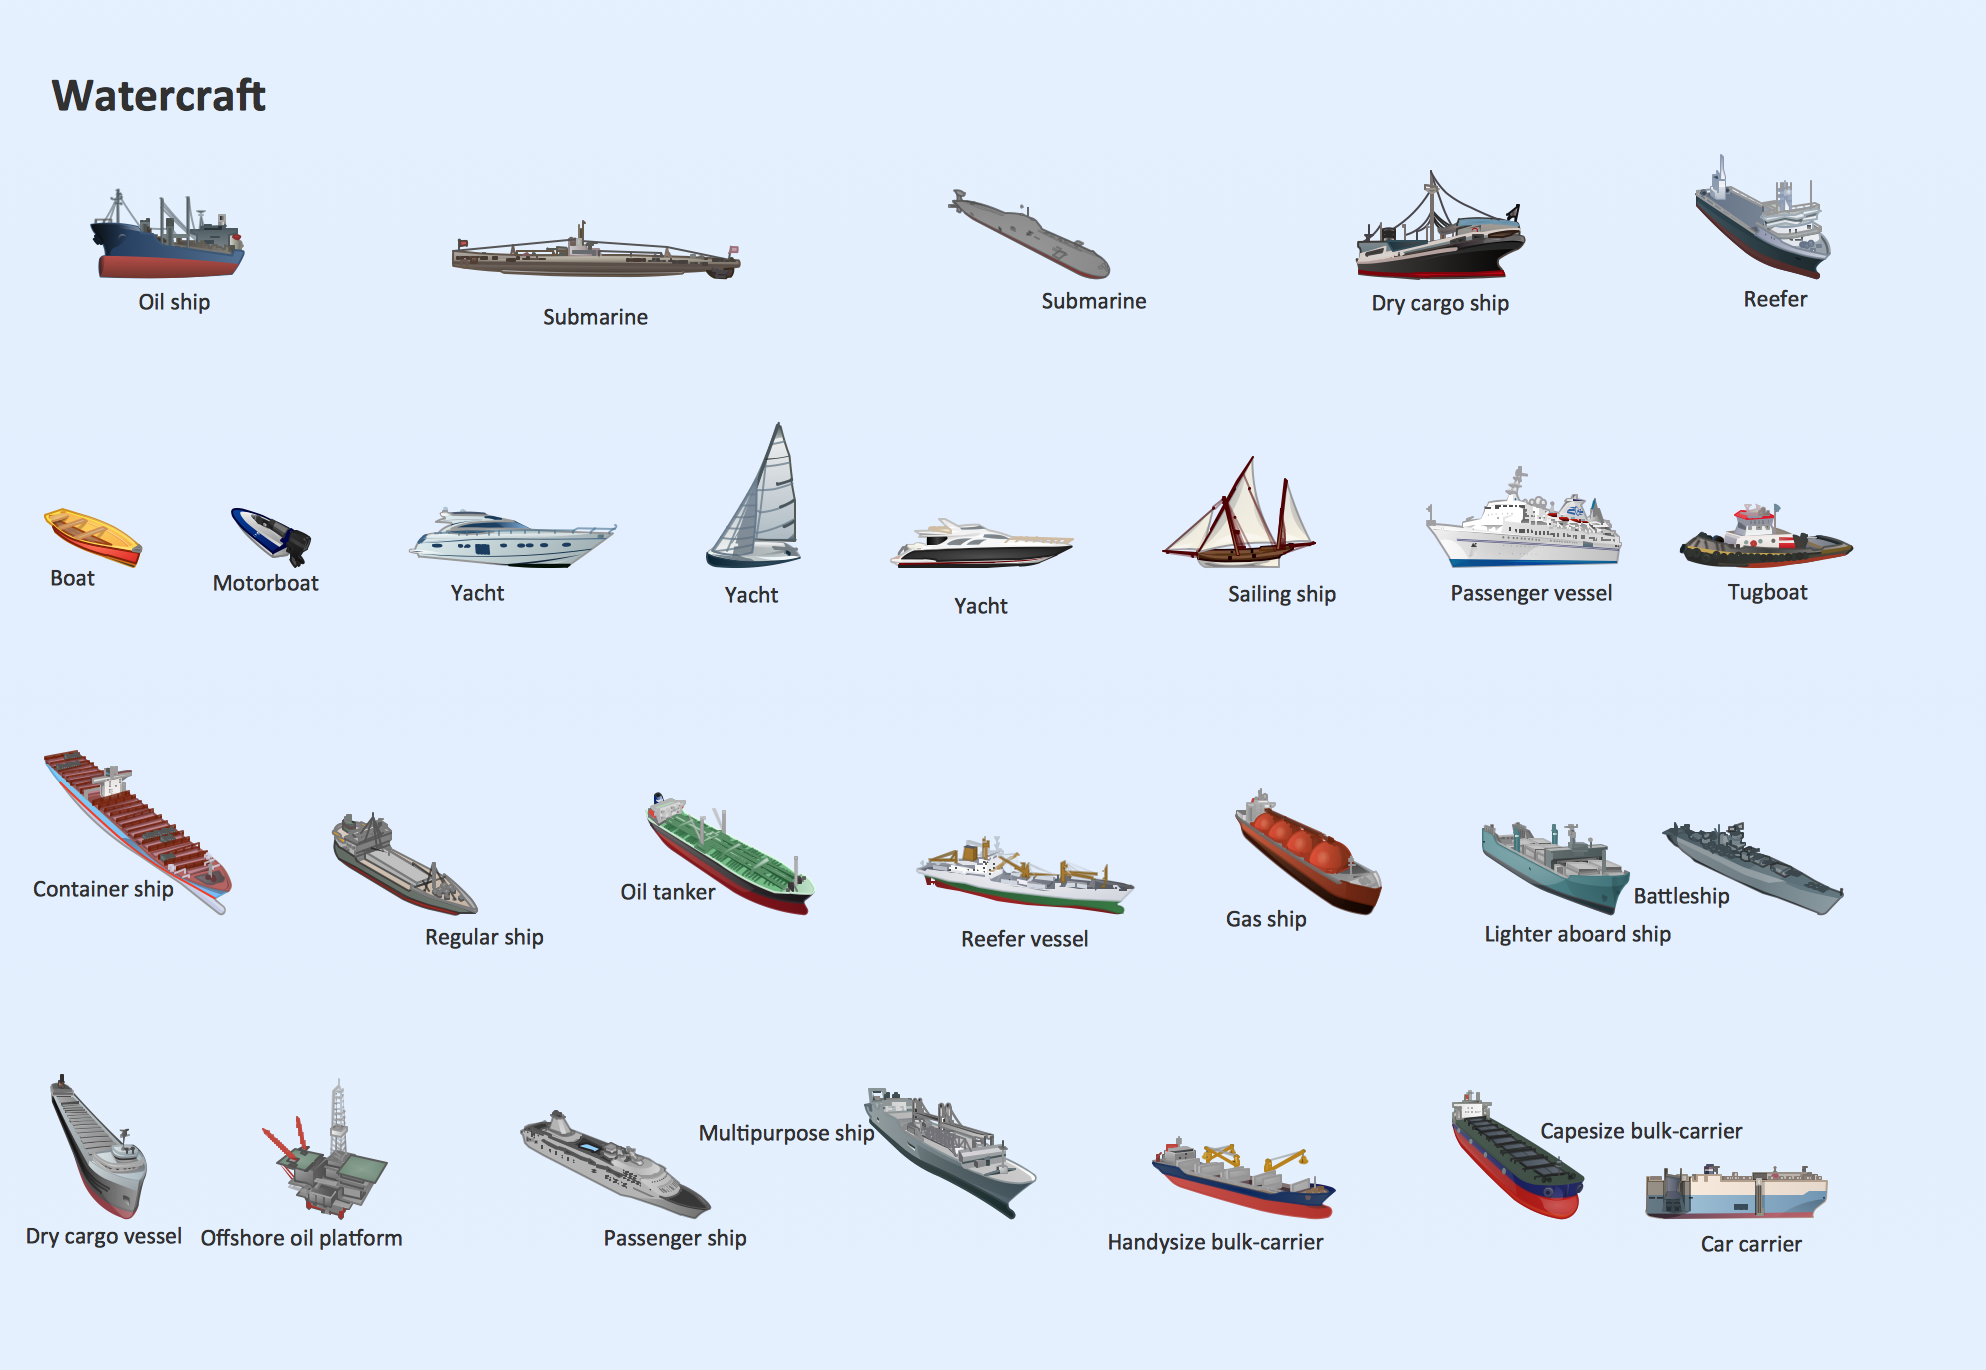
Picture: Watercraft - Design Elements
Related Solution:
Data flow diagrams are the graphical tool, used in the visualization of data flow of some data processing systems. It is the valuable process modeling tool. Also designing DFD is the important component of the initial part of any information system development project. The standard symbols are used to represent the interaction of a system components and how various kinds of components influence on data flow. The ConceptDraw Data Flow Diagrams solution is design to assist professional software engineers in making DFDs according to Gane and Sarson, and Yourdon and Coad notations.
Do you imagine yourself as a successful IT specialist? To your mind, they all use data flow diagram examples to learn and to get inspired. Aren’t you still with us?
Picture: Data Flow Diagram Examples
Related Solution:
House of Quality Matrix Software - Use the predesigned objects from the Involvement Matrix Objects Library from the Seven Management and Planning Tools Solution to create professional looking House of Quality Matrices in minutes.
Picture: House of Quality Matrix Software
Related Solution:
UML Collaboration Diagram depicts the interactions between objects or parts in terms of sequenced messages and describes both the static structure and dynamic behavior of a system.
Rapid UML solution provides templates, examples and libraries of stencils for quick and easy drawing all the types of system and software engineering diagrams according to UML 2.4 and 1.2 notations.
Picture: UML Collaboration Diagram (UML2.0)
Related Solution:


