Cross-Functional Flow Chart sample: Trading Process Diagram.
This example created with ConceptDraw DIAGRAM - Drawing Software for Vertical Cross Functional Flowchart.
TEN RELATED HOW TO's:
New way to present documents via Skype conference call on Mac. All participants receive files. Presentation can be created automatically from plenty document formats.
Picture: How To Send Presentation via Skype (Mac OS X)
Related Solution:
It doesn’t matter what kind of business you have, a bar or a gym, there are common concepts for any of them. One of those concepts is accounting, and to facilitate the work with the figures, you can use accounting flowchart symbols and create a clear and representative scheme. You can create flowchart for auditing, tax accounting and even for planning your own budget.
A graphical tool for displaying successive processes is flowchart. This method is mostly suited to represent an accounting process. The sequence of steps in the accounting process usually consists of standard accounting procedures, that can be depicted by using a minimal number of symbols, applied for the basic flowcharting. The advanced opportunity to create professional Accounting Flow charts is provided by ConceptDraw Accounting Flowcharts solution. It includes contains a library of accounting flowchart symbols used when drawing the accounting process flow.
Picture: Accounting Flowchart Symbols
Related Solution:
The UML diagram is a powerful tool which lets visually represent all system's components, the interactions between them and relationships with external user interface.
The Rapid UML solution for ConceptDraw DIAGRAM software offers diversity of UML flowchart symbols for drawing all types of UML diagrams.
Picture: UML Flowchart Symbols
Related Solution:
Design efficiently the technical flow charts in ConceptDraw DIAGRAM software for various fields and provide ✔️ clarity, ✔️ accuracy, ✔️ usability, ✔️ simple communication, analysis, and improvement
Picture: Technical Flow Chart Example
Related Solution:
Looking for a professional flow chart creator? Learn what a flowchart creator is, see real examples, explore symbol libraries and templates, and follow a step-by-step guide to create flowcharts in ConceptDraw DIAGRAM with the Flowcharts Solution.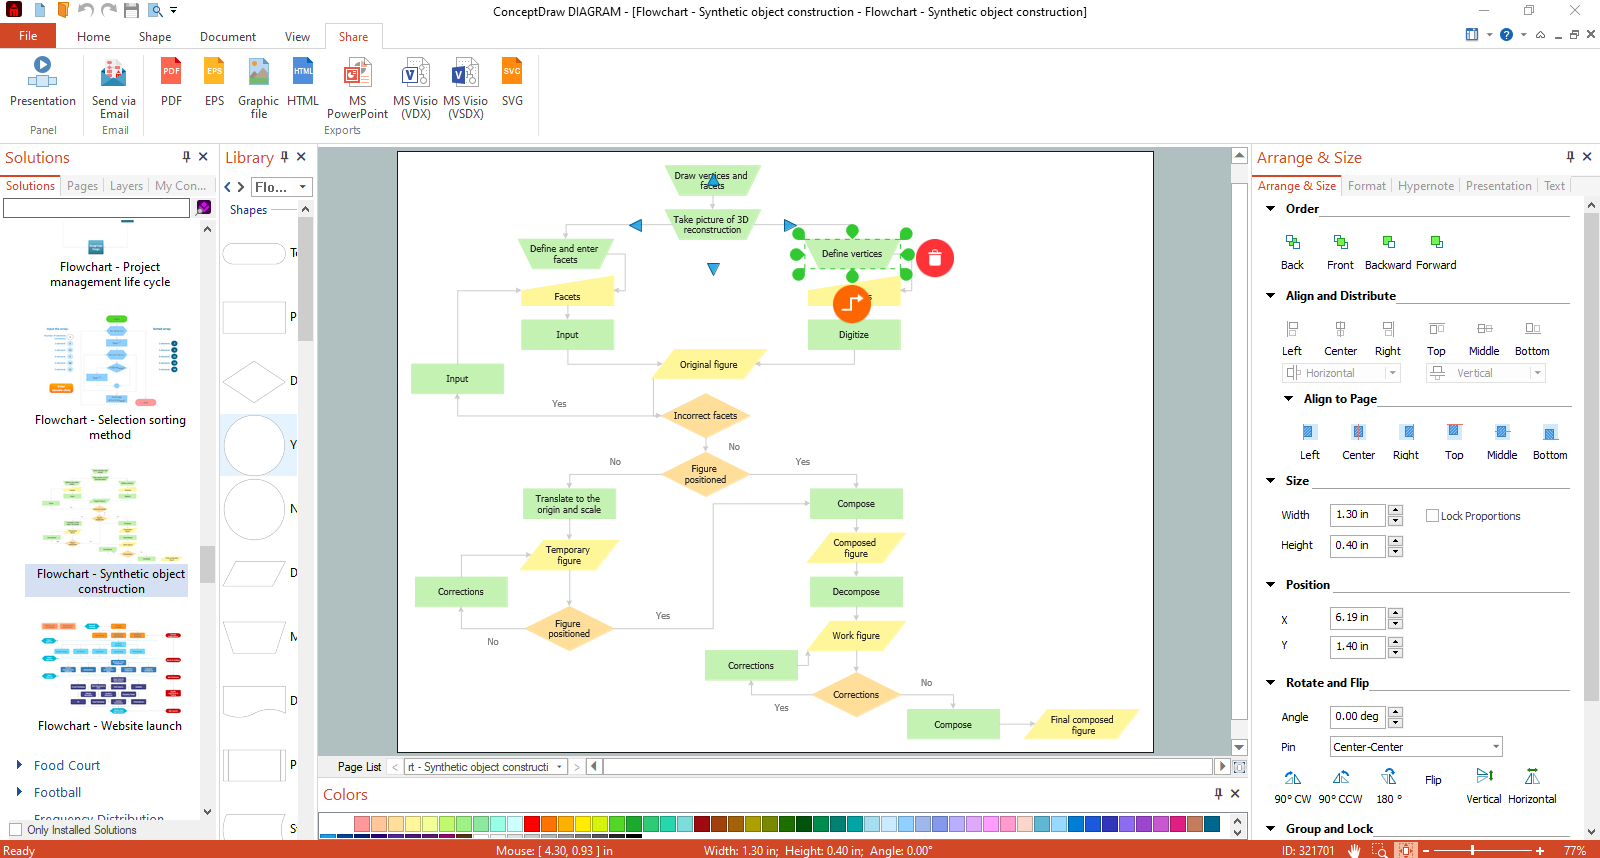
Picture: Flow Chart Creator
Related Solution:
Fast creating visualization for structured data is the main capability of ConceptDraw DIAGRAM software. With numerous vector stencils from object libraries and the RapidDraw technology this software becomes the best cross-functional flowchart software.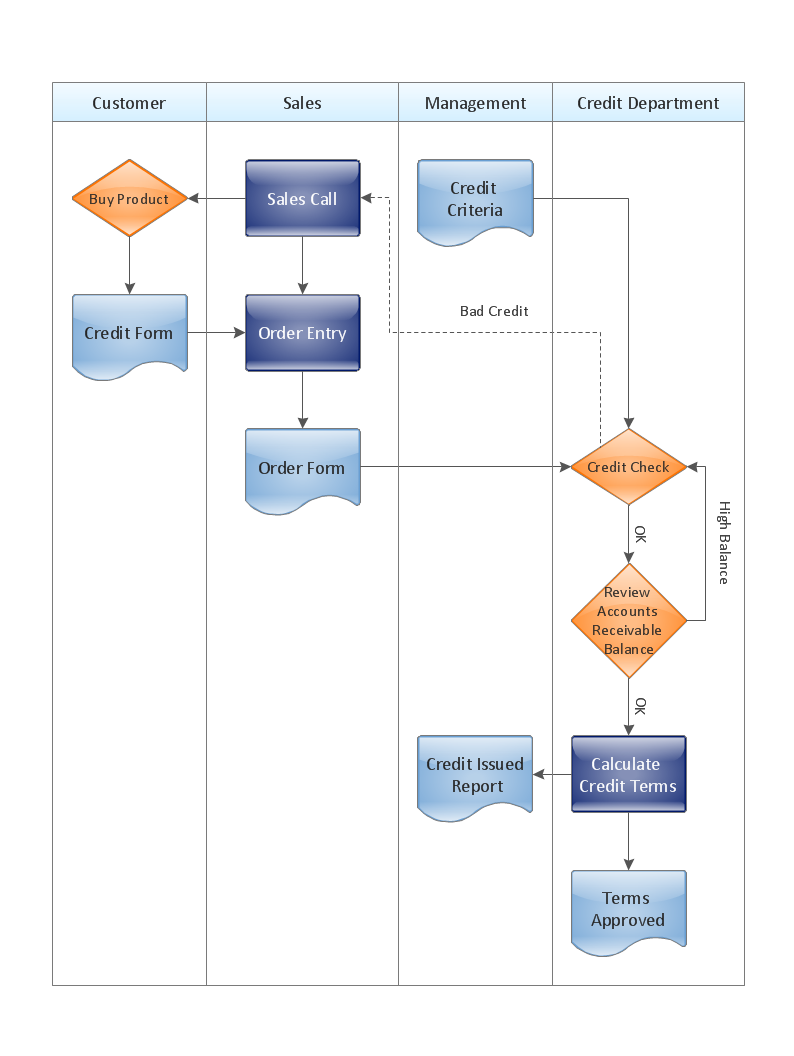
Picture: Create a Cross-Functional Flowchart
Related Solution:
You want design the Cross Functional Diagram and need powerful software? Then ConceptDraw DIAGRAM diagramming and vector drawing software extended with Cross-Functional Flowcharts Solution is exactly what you need.
Picture: Cross Functional Diagram
Related Solution:
Try ConceptDraw program, the perfect drawing tool for creating all kinds of great-looking drawings, charts, graphs, and illustrations.
Picture: Basic Diagramming
Related Solution:
A requisition form is one of the documents used for accounting in different manufacturing processes. There are two main types of requisition: a purchasing requisition and material requisition and difference between them is significant. Creating a flowchart might help you in understanding all the details of accounting process.
Flowcharts are a best visual method for dividing a large and complicated procedure into a several little clear pieces. The main value-ability of an effective flowchart is its simpleness. Material requisition flowcharts are used to document the process of relationships between the different departments and the purchasing department within an organization. The flow chart gives the step-by-step guide on how is carried out the procurement process of the materials necessary for the functioning of the organization. This type of flowchart along with many other business flowcharts, one can easy create using ConceptDraw Flowcharts solution.
Picture: Material Requisition Flowchart. Flowchart Examples
Related Solution:
Sometimes it’s quite useful to look on a problem from another view. To gain insight into an obstacle you should use SWOT analysis, and this will help you to see the whole situation. When composing a SWOT matrix, you divide your problem onto four elements - strengths, weaknesses, opportunities and threats and place them into matrix.
This sample SWOT analysis matrix of the athletic shoes producing company was designed on the base of template provided by ConceptDraw SWOT and TOWS Matrix Diagrams solution. It delivers number of easy-to-use templates and samples of SWOT and TOWS matrices for ConceptDraw DIAGRAM. Applying one of these templates, enables to quickly find out Strengths, Weaknesses, Opportunities, and Threats. After creating a list managers can consider methods the business can use to amplify strengths and to decrease weaknesses; realize opportunities; and avoid threats.
Picture: SWOT Analysis
Related Solution:
