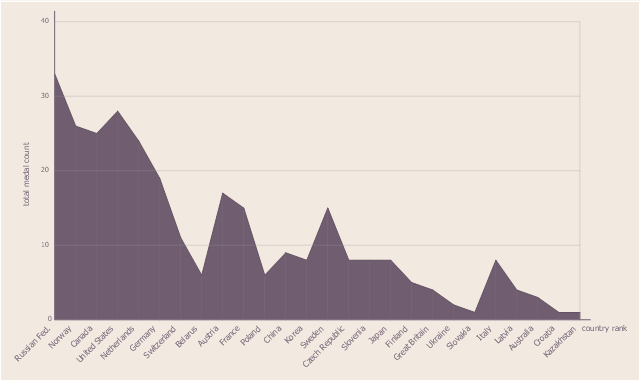
This area chart sample shows the 2014 Winter Olympics medal count by countries.
"The 2014 Winter Olympics medal table is a list of National Olympic Committees (NOCs) ranked by the number of medals won during the 2014 Winter Olympics, which were held in Sochi, Russia, from 7 to 23 February. Approximately 2,800 athletes representing 88 NOCs (+6 from 2010 Olympics) participated in 98 events (+12 from 2010) in 15 sports and disciplines (unchanged from 2010).
Host nation Russia topped the medal table with thirteen gold, eleven silver and nine bronze, the second Winter Olympics in a row the host nation led the gold medal count (following Canada in 2010). Slovenia won its first Winter Olympic gold medal, with a historic tie in alpine skiing." [2014 Winter Olympics medal table. Wikipedia]
The area graph example "Sochi 2014 Olympics medal count" was created using the ConceptDraw PRO diagramming and vector drawing software extended with the Area Charts solution from the Graphs and Charts area of ConceptDraw Solution Park.
Area graph
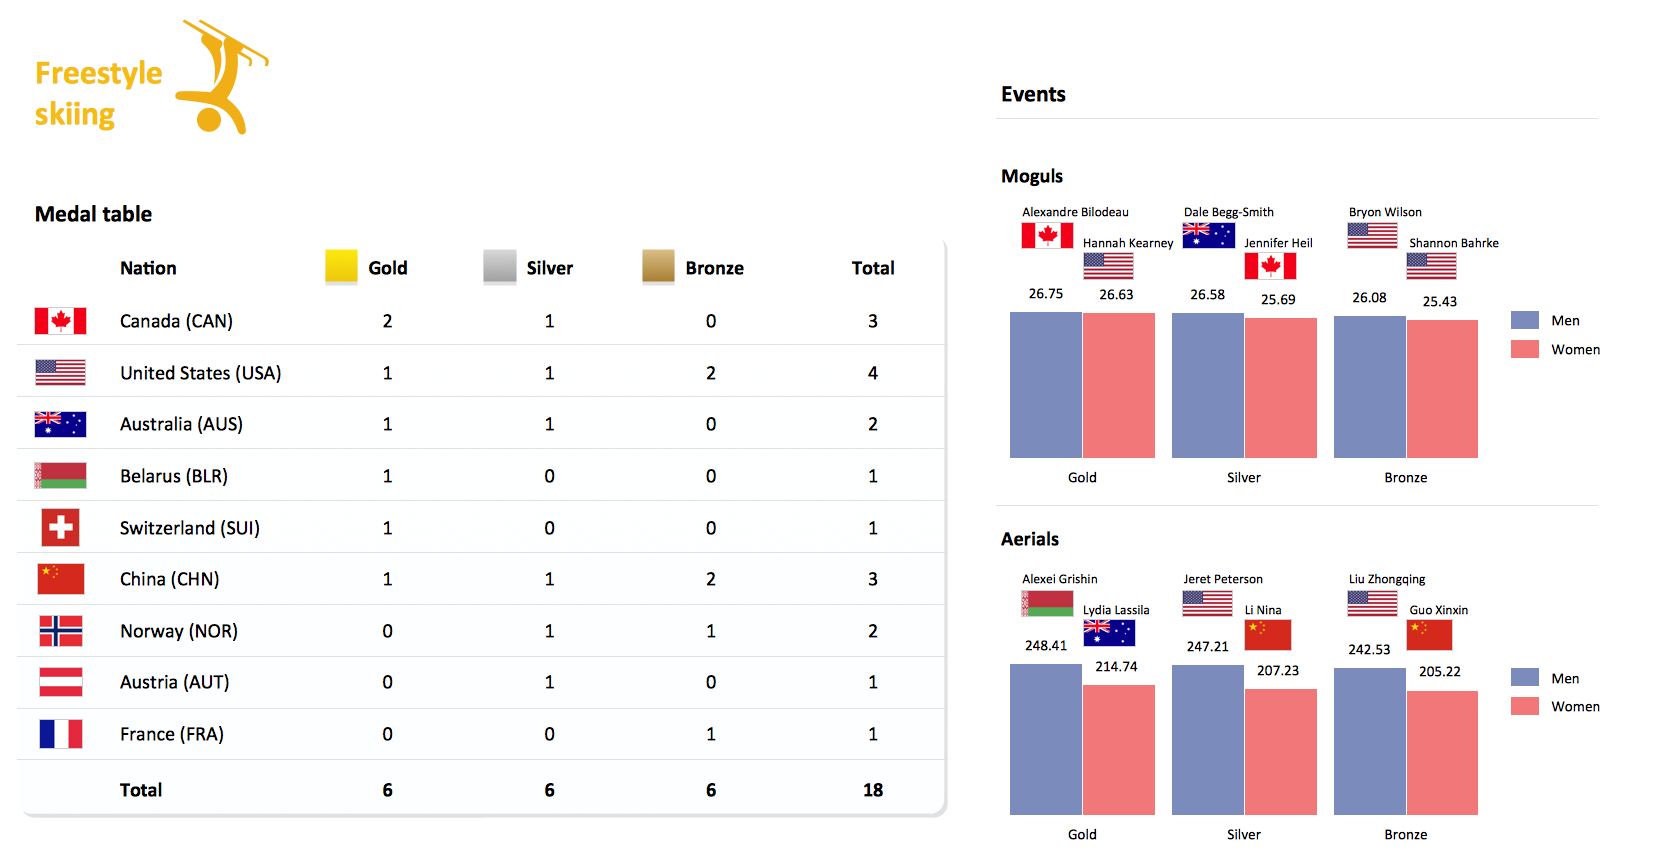
 Winter Sports
The Winter Sports solution from Sport area of ConceptDraw Solution Park contains winter sports illustration examples, templates and vector clipart libraries.
Winter Sports. Olympic Games Illustrations. Medal Summary
 Area Charts
Area Charts are used to display the cumulative totals over time using numbers or percentages; or to show trends over time among related attributes. The Area Chart is effective when comparing two or more quantities. Each series of data is typically represented with a different color, the use of color transparency in an object’s transparency shows overlapped areas and smaller areas hidden behind larger areas.
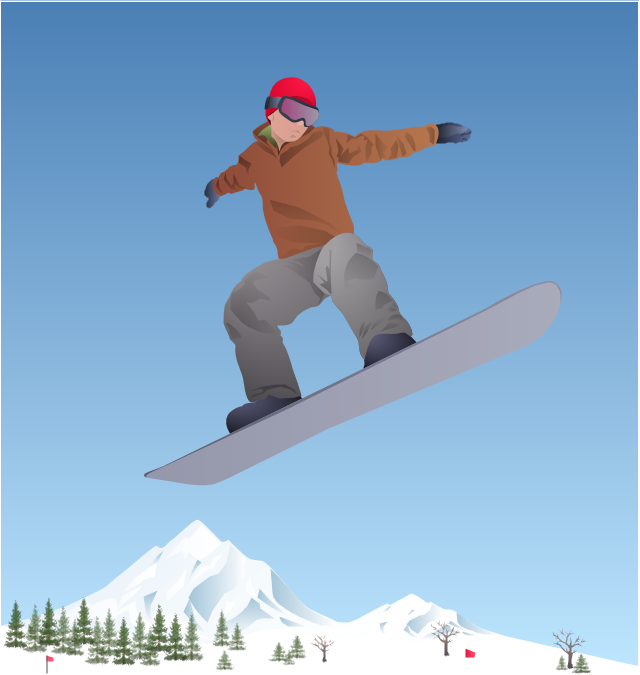
"Snowboarding at the 2014 Winter Olympics in Sochi will be held at the Rosa Khutor Extreme Park. The events will be held between 6 and 22 February 2014. A total of ten snowboarding events will be held at Sochi 2014 which will include parallel giant slalom, snowboard cross, half-pipe, and the new events of parallel slalom and slopestyle. ...
Men's slopestyle.
Women's slopestyle.
Men's halfpipe.
Women's halfpipe.
Women's snowboard cross.
Men's snowboard cross.
Men's and Women's parallel giant slalom.
Men's and Women's parallel slalom.
A total of 252 quota spots are available to athletes to compete at the games. A maximum of 24 athletes can be entered by a National Olympic Committee, with a maximum of 14 men or 14 women. The five different events have different quota amounts allocated to them. Countries are allowed to enter the same athlete into more then one event, further reducing the amount of athletes competing. ...
31 nations are scheduled to participate, with number of athletes in parenthesis." [Snowboarding at the 2014 Winter Olympics. Wikipedia]
The vector illustration "Winter Olympics - Snowboard" was created using the ConceptDraw PRO diagramming and vector drawing software extended with the Winter Sports solution. The Winter Sports solution from the Sport area of ConceptDraw Solution Park contains the Sochi 2014 Winter Olimpics sports vector pictograms and clipart libraries and examples of diagrams, illustrations and infographics.
Vector clip art
Winter Sports. Illustrations and Visualize Statistics
Design Pictorial Infographics. Design Infographics

- Sochi 2014 Olympics medal count | Sochi 2014 Winter Olympics ...
- Sochi 2014 Olympics medal count | Design elements - Winter ...
- Winter Sports. Olympic Games Infographics. Medal Table | Sochi ...
- Winter Olympics pictograms - Vector stencils library | Winter ...
- Sochi 2014 Winter Olympics ® - Snowboarding results | Winter ...
- Winter Olympics - Curling | Winter Olympics - Biathlon | Winter ...
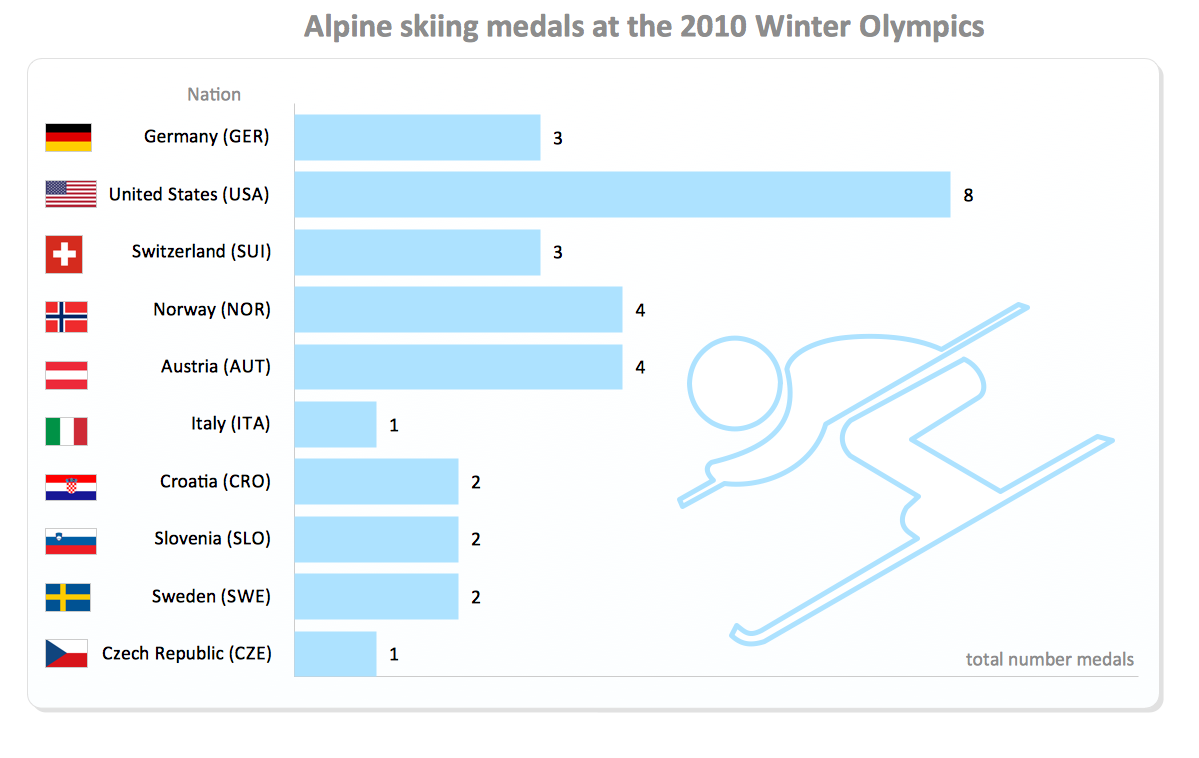
- Alpine skiing medals at the 2010 Winter Olympics - Infographics with ...
- Winter Sports. Olympic Games Infographics. Medal Table | Winter ...
- Winter Sports. Olympic Games Infographics. Medal Table | Winter ...
- Winter Olympics - Snowboarding | Winter Sports | Winter Olympics ...