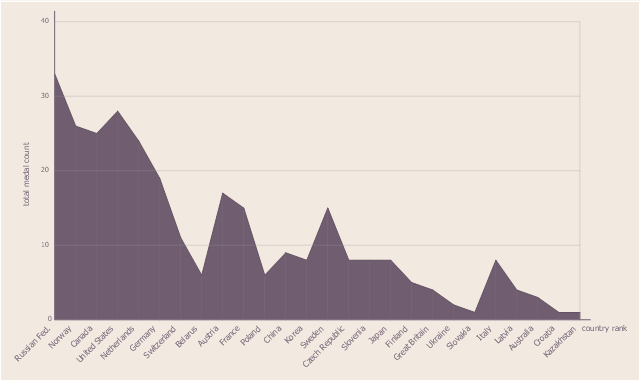
"The 2014 Winter Olympics medal table is a list of National Olympic Committees (NOCs) ranked by the number of medals won during the 2014 Winter Olympics, which were held in Sochi, Russia, from 7 to 23 February. Approximately 2,800 athletes representing 88 NOCs (+6 from 2010 Olympics) participated in 98 events (+12 from 2010) in 15 sports and disciplines (unchanged from 2010).
Host nation Russia topped the medal table with thirteen gold, eleven silver and nine bronze, the second Winter Olympics in a row the host nation led the gold medal count (following Canada in 2010). Slovenia won its first Winter Olympic gold medal, with a historic tie in alpine skiing." [2014 Winter Olympics medal table. Wikipedia]
The area chart example "Sochi 2014 Olympics medal count" was created using the ConceptDraw PRO diagramming and vector drawing software extended with the Area Charts solution from the Graphs and Charts area of ConceptDraw Solution Park.
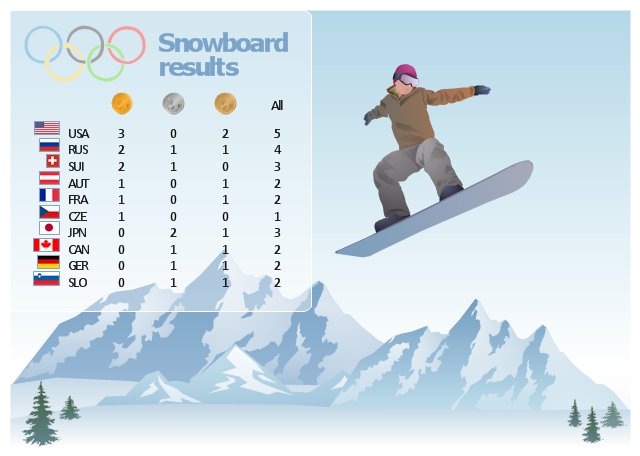
"Snowboarding at the 2014 Winter Olympics in Sochi was held at the Rosa Khutor Extreme Park. The events were held between 6 and 22 February 2014. A total of ten snowboarding events were held at Sochi 2014 which include parallel giant slalom, snowboard cross, half-pipe, and the new events of parallel slalom and slopestyle.
A crash in practice from Norwegian slopestyle snowboarder Torstein Horgmo, who fractured his collarbone, and complaints from other athletes that some jumps were too steep have prompted organizers to modify the slopestyle course in the week before the Games." [Snowboarding at the 2014 Winter Olympics. Wikipedia]
The sport infographics and medal table example "Sochi 2014 Winter Olympics ® - Snowboarding results" was created using the ConceptDraw PRO diagramming and vector drawing software extended with the Winter Sports solution from the Sport area of ConceptDraw Solution Park.
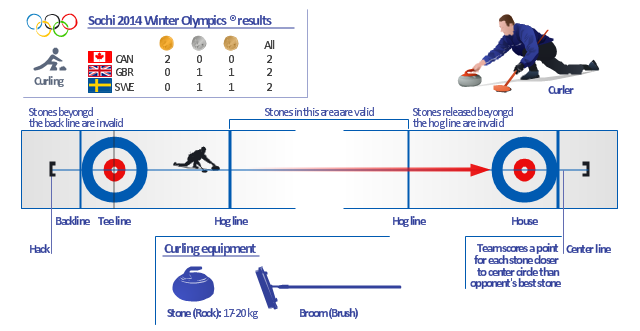
The example infographics "Curling sheet" shows Sochi 2014 Winter Olympics curling medal table, curing sheet scheme, curler and game equipment clipart images.
"The curling competition of the 2014 Winter Olympics was held at the Ice Cube Curling Center, nicknamed "the Ice Cube". It is the sixth time that curling was on the Olympic program. In both the men's and women's competitions, ten nations competed. These two events took place between 10–21 February 2014." [Curling at the 2014 Winter Olympics. Wikipedia]
The sport infographics example "Curling sheet" is created using the ConceptDraw PRO diagramming and vector drawing software extended with the Winter Sports solution from the Sport area of ConceptDraw Solution Park.
 Area Charts
Area Charts are used to display the cumulative totals over time using numbers or percentages; or to show trends over time among related attributes. The Area Chart is effective when comparing two or more quantities. Each series of data is typically represented with a different color, the use of color transparency in an object’s transparency shows overlapped areas and smaller areas hidden behind larger areas.
 Winter Sports
The Winter Sports solution from Sport area of ConceptDraw Solution Park contains winter sports illustration examples, templates and vector clipart libraries.
Winter Sports Vector Clipart. Medal Map. Spatial Infographics
Tracking Olympic results in visual format is the most modern way to deliver statistics to a broad audience. This is a good example of an illustrated table you may easily modify, print, or publish on web from ConceptDraw Winter Sports solution .- Sochi 2014 Olympics medal count | Winter Sports. Olympic Games ...
- Winter Sports. Olympic Games Infographics. Medal Table | Sochi ...
- Sochi 2014 Olympics medal count | Design elements - Winter ...
- Sochi 2014 Olympics medal count
- Winter Sports. Olympic Games Infographics. Medal Table | Winter ...
- Winter Sports. Olympic Games Infographics. Medal Table | Winter ...
- Sochi 2014 Winter Olympics ® - Snowboarding results | Winter ...
- Sochi 2014 Winter Olympics ® - Snowboarding results | Medals by ...
- Winter Sports. Olympic Games Infographics. Medal Table
- Winter Sports. Olympic Games Infographics. Medal Table | Winter ...
- Winter Sports. Olympic Games Infographics. Medal Table | Basic ...
- Winter Sports. Olympic Games Infographics. Medal Table | Winter ...
- Winter Sports. Olympic Games Infographics. Medal Table | Winter ...
- Winter Sports. Olympic Games Infographics. Medal Table
- Winter Sports. Olympic Games Infographics. Medal Table | Winter ...
- Winter Sports | Winter Sports. Olympic Games Infographics. Medal ...
- Winter Sports | Winter Sports. Olympic Games Illustrations. Medal ...
- Winter Sports | Winter Sports. Using Olympic Games Clipart to ...
- Winter Sports. Olympic Games Infographics. Medal Table
- Sochi 2014 Olympics - Men's hockey tournament schedule ...


