This site uses cookies. By continuing to browse the ConceptDraw site you are agreeing to our Use of Site Cookies.
HelpDesk

How to Draw a Circular Arrows Diagram

The cyclic recurrence is a fundamental property of multiple systems. The cycle is a process which consists of elements (phases, stages, stages) following each other. Many processes in astronomy, biology, chemistry, physics, mathematics, etc. have a cycle properties. It is also widely used in information technologies and marketing analysis. Graphical representation of cyclic processes can have many forms. It can be a circle, parabola, hyperbola, ellipse, and others. A Circular Arrows Diagram is used as one of the statistical charts in the business, mass media and marketing. ConceptDraw DIAGRAM provides tools for making easy drawing Circular Arrows Diagrams.
HelpDesk

How to Create a Venn Diagram

Venn diagrams were invented by John Venn as a method of depicting relationships between different components. A Venn diagram consists of two or more circles. Each circle represents a specific group or set. The entities which are depicted by circles generally have some common characteristics. A Venn Diagram shows all the possible logical relations between these entities. Any properties that belong to more than one set should be indicated in the sections where the circles overlap. A Venn Diagram can be useful to visually summarize the status and future viability of a project. ConceptDraw DIAGRAM allows you to make Venn diagrams using the Venn Diagrams solution.
The vector stencils library "Circular diagrams" contains 42 templates of circular diagrams: circular arrow diagram, circular motion diagram, arrow ring chart, doughnut chart (donut chart), circle pie chart, diamond pie chart, circle diagram, pie chart, ring chart, loop diagram, block loop diagram, arrow loop circle, crystal diagram, triangular diagram, diamond diagram, pentagon diagram, hexagon diagram, heptagon diagram, cycle diagram (cycle chart), stacked Venn diagram (onion diagram), arrow circle diagram.
Use these shapes to illustrate your marketing and sales documents, presentations, webpages and infographics in the ConceptDraw PRO diagramming and vector drawing software extended with the Target and Circular Diagrams solution from the Marketing area of ConceptDraw Solution Park.
www.conceptdraw.com/ solution-park/ marketing-target-and-circular-diagrams
Circular arrow diagram 1
Circular arrow diagram 1, circular arrow diagram, circular motion diagram,
Circular arrow diagram 2
Circular arrow diagram 2, circular arrow diagram, circular motion diagram,
Arrow ring chart
Arrow ring chart, circular arrow diagram, circular motion diagram,
Doughnut chart
Doughnut chart, doughnut chart, pie chart, ring chart, donut chart,
Diamond pie chart
Diamond pie chart, diamond pie chart, circular diagram,
Pie chart
Pie chart, pie chart,
Circle diagram
Circle diagram, circle diagram, circular diagram,
Circle pie chart 2
Circle pie chart 2, circle pie chart, circular diagram, marketing mix diagram,
Circle pie chart 1
Circle pie chart 1, circle pie chart, circular diagram, marketing mix diagram,
Ring chart 1 - 3 elements
Ring chart 1 - 3 elements, doughnut chart, pie chart, ring chart, donut chart,
Ring chart 1 - 4 elements
Ring chart 1 - 4 elements, doughnut chart, pie chart, ring chart, donut chart,
Ring chart 1 - 5 elements
Ring chart 1 - 5 elements, doughnut chart, pie chart, ring chart, donut chart,
Ring chart 1 - 6 elements
Ring chart 1 - 6 elements, doughnut chart, pie chart, ring chart, donut chart,
Ring chart 1 - 7 elements
Ring chart 1 - 7 elements, doughnut chart, pie chart, ring chart, donut chart,
Ring chart 2 - 3 elements
Ring chart 2 - 3 elements, doughnut chart, pie chart, ring chart, donut chart,
Ring chart 2 - 4 elements
Ring chart 2 - 4 elements, doughnut chart, pie chart, ring chart, donut chart,
Ring chart 2 - 5 elements
Ring chart 2 - 5 elements, doughnut chart, pie chart, ring chart, donut chart,
Ring chart 2 - 6 elements
Ring chart 2 - 6 elements, doughnut chart, pie chart, ring chart, donut chart,
Ring chart 2 - 7 elements
Ring chart 2 - 7 elements, doughnut chart, pie chart, ring chart, donut chart,
Crystal diagram - 3 elements
Crystal diagram - 3 elements, crystal diagram, triangular diagram,
Crystal diagram - 4 elements
Crystal diagram - 4 elements, crystal diagram, diamond diagram,
Crystal diagram - 5 elements
Crystal diagram - 5 elements, crystal diagram, pentagon diagram,
Crystal diagram - 6 elements
Crystal diagram - 6 elements, crystal diagram, hexagon diagram,
Crystal diagram - 7 elements
Crystal diagram - 7 elements, crystal diagram, heptagon diagram,
Stacked Venn diagram - 4
Stacked Venn diagram - 4, stacked Venn diagram, onion diagram,
Stacked Venn diagram - 5
Stacked Venn diagram - 5, stacked Venn diagram, onion diagram,
Stacked Venn diagram - 6
Stacked Venn diagram - 6, stacked Venn diagram, onion diagram,
Stacked Venn diagram - 7
Stacked Venn diagram - 7, stacked Venn diagram, onion diagram,
Basic loop diagram
Basic loop diagram, basic loop diagram,
Block loop diagram
Block loop diagram, block loop diagram,
Arrow loop circle
Arrow loop circle, arrow loop circle,
Arrow loop - 3 circles
Arrow loop - 3 circles, arrow loop diagram,
Arrow loop - 4 circles
Arrow loop - 4 circles, arrow loop diagram,
Arrow loop - 5 circles
Arrow loop - 5 circles, arrow loop diagram,
Arrow loop - 6 circles
Arrow loop - 6 circles, arrow loop diagram,
Arrow loop - 7 circles
Arrow loop - 7 circles, arrow loop diagram,
Arrow circle diagram - 3
Arrow circle diagram - 3, arrow circle diagram,
Arrow circle diagram - 4
Arrow circle diagram - 4, arrow circle diagram,
Stacked Venn diagram - 3
Stacked Venn diagram - 3, stacked Venn diagram, onion diagram,
Arrow circle diagram - 5
Arrow circle diagram - 5, arrow circle diagram,
Arrow circle diagram - 6
Arrow circle diagram - 6, arrow circle diagram,
Arrow circle diagram - 7
Arrow circle diagram - 7, arrow circle diagram,
HelpDesk

How to Diagram Sentences

Diagramming sentences is a playful, fun way of learning English Grammer. Sentences can be very complex and can contain many different parts of speech which implicate many different grammatical rules. Diagramming sentences will help you to make sure every part of your sentence are grammatically correct and provides you with a more comprehensive understanding of the English Language. A Sentence Diagram displays the parts of a sentence as a diagram in order to show the relationship of words and groups of words within the sentence. Sentence Diagram shows the relationship between the proposal of its parts. This is a good way to teach grammar! Sentence Diagram helps to make the writing more coherent as well as more interesting to read. ConceptDraw DIAGRAM allows you to create clear sentence diagrams using the special templates and vector stencils library.

Bubble diagrams in Landscape Design with ConceptDraw DIAGRAM

To define the links between the different areas of your own landscape design and see the project from aside, we recommend to draw landscape diagram called bubble one which is analogue of «mind maps» as it allows us to create approximate image of our future proper landscape view. Use special libraries (and we have plenty of them) with objects of landscape design to be able to create the detailed plan of your landscape which will be looking so smart and professionally good as the samples we provide were created by designers who know so much about making such kinds of design plans. Having ConceptDraw DIAGRAM as the assistant in your work, will ensure the success after using our product. Make the bubble diagrams as well as any other ones in minutes with ease having our application called ConceptDraw DIAGRAM and you will see how quick it will change your life simplifying lots of work.
HelpDesk

How to Draw a Line Chart Quickly

A common line chart is a graphical representation of the functional relationship between two series of data. A line chart that is created by connecting a series of data points together with a straight line is the most basic type of a line chart. A line chart can be used for depicting data that changes continuously over time. It is extensively utilized in statistics, marketing, and financial business. ConceptDraw Basic Line Graph solution provides the possibility to make 2D line charts quickly and effortlessly.
HelpDesk

How to Add a Block Diagram to a PowerPoint Presentation

Block diagram is a rather universal type of charts - compositions from geometric blocks can be applied to describe various kinds of processes or systems, consisting of components, which depend on each other. Block diagrams are indispensable when you need to represent a processor system on a basic level. With blocks, you can easily depict the basic elements of the process, without drilling down. The PowerPoint presentation of major process steps and key process participants can be very informative and helpful. Using ConceptDraw DIAGRAM, you can easily convert a block diagram to an MS PowerPoint presentation.

usa map, map of usa, map of usa states, usa map states, usa maps, us map with cities, usa states map, us interstate map, usa map with capitals, printable us map USA Maps

usa map, map of usa, map of usa states, usa map states, usa maps, us map with cities, usa states map, us interstate map, usa map with capitals, printable us map
Use the USA Maps solution to create a map of USA, a US interstate map, printable US maps, US maps with cities and US maps with capitals. Create a complete USA states map.
HelpDesk

How to Design an Interface Mockup for iPhone Application

The Apple iPhone user interface has become something of a standard for smartphones, and mobile devices in general. A well-designed user interface (UI) is very important for user-friendly navigation and the best correlation with operating system logic. Development of successful iPhone App UI requires a planning and prototyping stage. An iPhone UI diagram can be employed to give a general view of the device's screen, upon which elements can be placed and re-arranged as necessary. Using ConceptDraw DIAGRAM you can mock-up an iPhone UI system so that you can figure out how best to represent user interface (UI) elements for the development of a new iPhone App.
HelpDesk

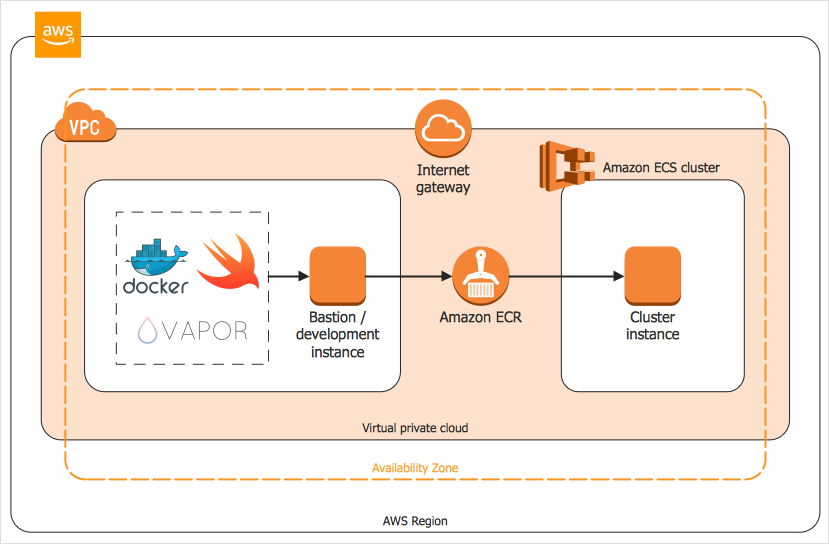
How to Create an AWS Architecture Diagram

Displaying an Amazon Web Service (AWS) cloud actually requires large amounts of attention to detail. Every element of technology has to be addressed: software, middleware, transaction processing, scaling, data storage; the complete list is staggering. Using the ConceptDraw AWS Architecture Diagrams solution makes much easier the work on documenting the Amazon Web Service architecture. The ConceptDraw AWS Architecture Diagrams solution includes icons, sample, and templates for some Amazon Web Services products and resources, to be used when building architecture diagrams. The icons are simple so that user can easily incorporate them in his drawings. AWS Architecture Diagrams can be used in presentations, datasheets, or any other technical visualizations.
HelpDesk

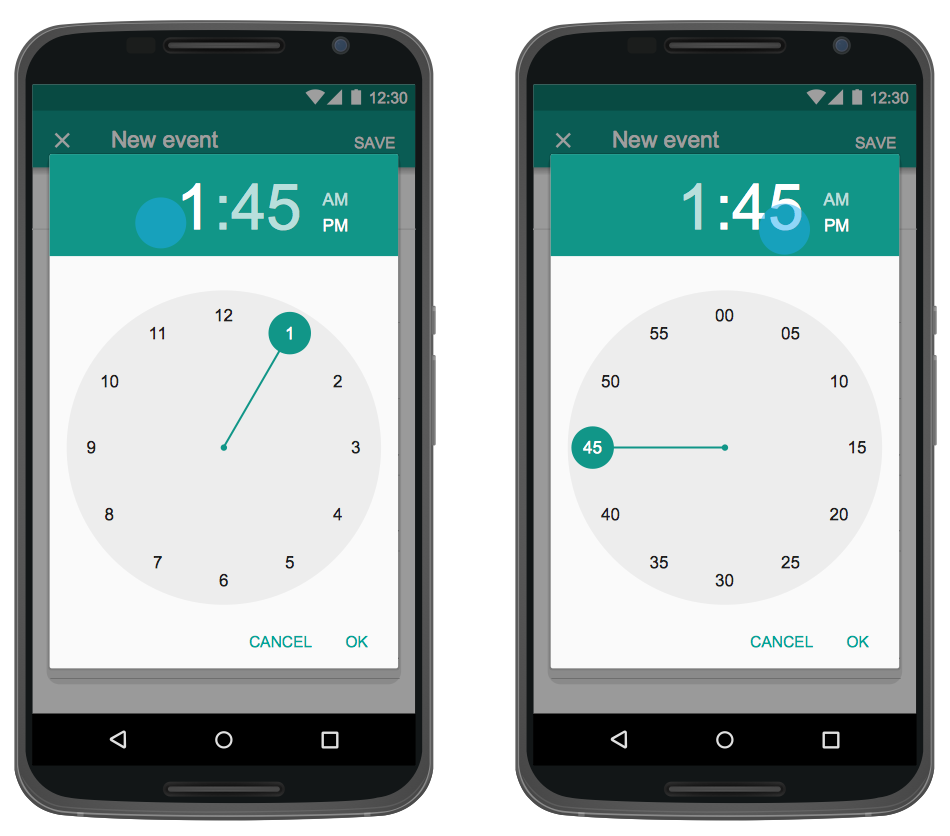
How to Design an Interface Mock-up of an Android Application

Uses Interface prototyping is much convenient when you can work through a diagram similar to the device design. ConceptDraw DIAGRAM allows you to develop Android User Interface (UI) prototypes using the special templates and vector libraries of the specific user interface elements. Using ConceptDraw DIAGRAM you can mock-up an Android UI system so that you can figure out how best to represent user interface (UI) elements for the development of a new mobile Apps.
HelpDesk

How to Draw a Block Diagram

Block diagram is a simple chart that use blocks to show some elements or activities, and connectors that show the relationship between neighboring blocks. They are commonly simple, giving an overview of a process without necessarily going into the specifics of implementation. Block diagrams are commonly used to depict a general description of a system and its activity. A most known sample of a block diagram is a flow chart, used in many types of business as a common method of representing repeated processes. Easy and a simple creation, a number of objects and connectors make the block diagram a many-sided tool for various industries. The ability to make block diagrams is delivered by the ConceptDraw Block Diagrams solution.

ducation infographics and infograms, Business intelligence dashboards, Business intelligence charts and maps, Bubble diagrams and charts, Spray diagrams, Circle-Spoke diagrams and models, Circle diagrams, Circular arrows diagrams, Circular flow diagrams, Education Package

ducation infographics and infograms, Business intelligence dashboards, Business intelligence charts and maps, Bubble diagrams and charts, Spray diagrams, Circle-Spoke diagrams and models, Circle diagrams, Circular arrows diagrams, Circular flow diagrams,
Education Package is a comprehensive set of multifarious graphical solutions from ConceptDraw Solution Park, collected together in help to ConceptDraw DIAGRAM users working in a field of science, education and training, which is aimed at improving the quality of education and helping to design with ease variety of interesting and colorful educational materials, diagrams, charts and maps. Use it to present the information and knowledge in an interesting, clear, structured and simple form to achieve a success in education and pedagogy, to maintain the interest of students and pupils throughout the whole learning process, at the lectures, lessons and even during independent work with additional materials, to contribute to better perception of scientific information by listeners during the conferences and reports.
HelpDesk

How to Create a Computer Network Diagram

Computer Network diagram is intended to depict how a computer network is built and connected. It shows how data transfers between connections and presents an overview of hardware and devices used.
With the ConceptDraw solution for Computer Network Diagrams, system administrators, network architects, and other related IT specialists have a perfect drawing tool that supplies adjective vector stencils representing hardware, telecom devices, and logical symbols that enhance possibilities in network diagramming, however, complex the real network may be.