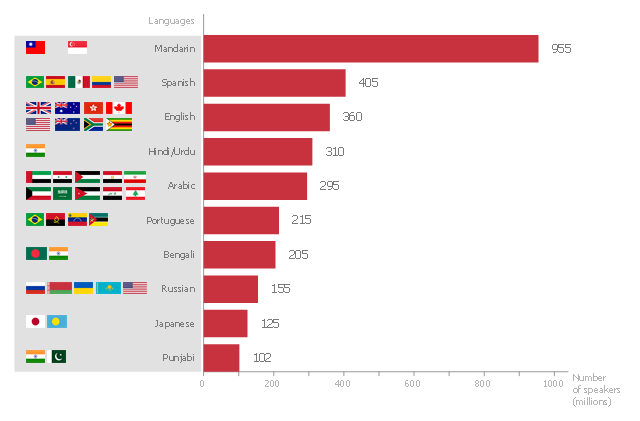
This bar graph sample shows the number of speakers for the most spoken languages of the world.
"In the philosophy of language, a natural language (or ordinary language) is any language which arises in an unpremeditated fashion as the result of the innate facility for language possessed by the human intellect. A natural language is typically used for communication, and may be spoken, signed, or written. Natural language is distinguished from constructed languages and formal languages such as computer-programming languages or the "languages" used in the study of formal logic, especially mathematical logic. ... Though the exact definition varies between scholars, natural language can broadly be defined in contrast on the one hand to artificial or constructed languages, computer programming languages like Python and international auxiliary languages like Esperanto, and on the other hand to other communication systems in nature, such as the waggle dance of bees. Although there are a variety of natural languages, any cognitively normal human infant is able to learn any natural language. By comparing the different natural languages, scholars hope to learn something about the nature of human intelligence and the innate biases and constraints that shape natural language, which are sometimes called universal grammar. The term "natural language" refers only a language that has developed naturally, and hence to actual speech, rather than prescribed speech. Hence, unstandardized speech (such as African American Vernacular English) is natural, whereas standardized speech such as Standard American English, which is in part prescribed, is somewhat artificial." [Natural language. Wikipedia]
The horizontal bar chart example "The most spoken languages of the world" was created using the ConceptDraw PRO diagramming and vector drawing software extended with the Bar Graphs solution from the Graphs and Charts area of ConceptDraw Solution Park.
Horizontal bar graph
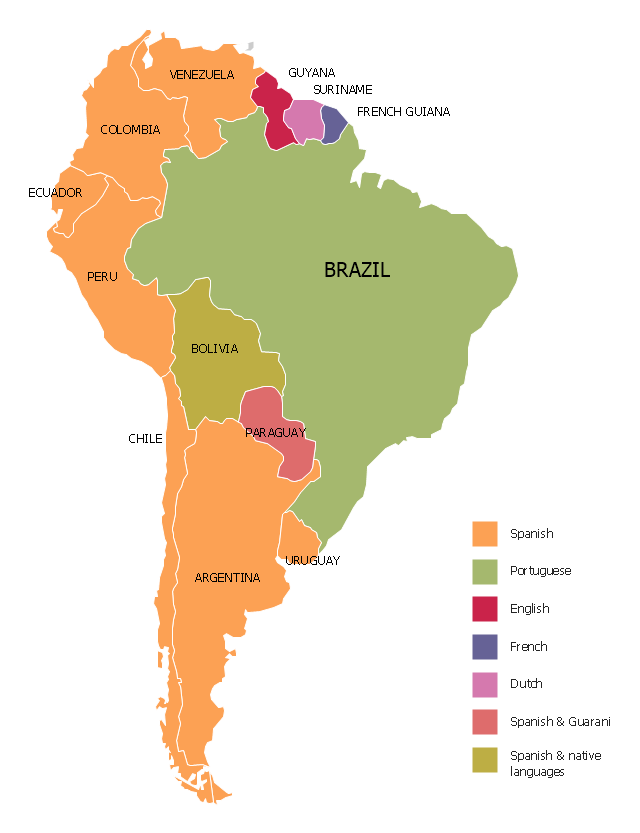
"Spanish and Portuguese are the most spoken languages in South America, with approximately 200 million speakers each. Spanish is the official language of most countries, along with other native languages in some countries. Portuguese is the official language of Brazil. Dutch is the official language of Suriname; English is the official language of Guyana, although there are at least twelve other languages spoken in the country, including Hindi and Arabic. English is also spoken in the Falkland Islands. French is the official language of French Guiana and the second language in Amapá, Brazil.
Indigenous languages of South America include Quechua in Ecuador, Peru, Chile, Argentina, Colombia, and Bolivia; Wayuunaiki in northern Colombia (La Guajira); Guaraní in Paraguay and, to a much lesser extent, in Bolivia; Aymara in Bolivia, Peru, and less often in Chile; and Mapudungun is spoken in certain pockets of southern Chile and, more rarely, Argentina. At least three South American indigenous languages (Quechua, Aymara, and Guarani) are recognized along with Spanish as national languages." [South America. Wikipedia]
The Languages of South America map example was redesigned from Wikimedia Commons file: Languages of South America (en).svg.
[commons.wikimedia.org/ wiki/ File:Languages_ of_ South_ America_ (en).svg]
This file is licensed under the Creative Commons Attribution-Share Alike 3.0 Unported license. [creativecommons.org/ licenses/ by-sa/ 3.0/ deed.en]
The Languages of South America map example was drawn using ConceptDraw PRO diagramming and vector drawing software extended with design elements library South America.
The Languages of South America map example is included in the Continent Maps solution from the Maps area of ConceptDraw Solution Park.
Thematic map - South America
Bar Chart Software

Bar Chart

 Bar Graphs
The Bar Graphs solution enhances ConceptDraw DIAGRAM functionality with templates, numerous professional-looking samples, and a library of vector stencils for drawing different types of Bar Graphs, such as Simple Bar Graph, Double Bar Graph, Divided Bar Graph, Horizontal Bar Graph, Vertical Bar Graph, and Column Bar Chart.
Examples of Flowcharts, Org Charts and More


Chart Examples

The vector stencils library "ABC" contains 87 symbols of English letters, numerals and punctuation marks.
"An alphabet is a standard set of letters (basic written symbols or graphemes) which is used to write one or more languages based on the general principle that the letters represent phonemes (basic significant sounds) of the spoken language. This is in contrast to other types of writing systems, such as syllabaries (in which each character represents a syllable) and logographies (in which each character represents a word, morpheme, or semantic unit). ... There are dozens of alphabets in use today, the most popular being the Latin alphabet (which was derived from the Greek). Many languages use modified forms of the Latin alphabet, with additional letters formed using diacritical marks. ... Alphabets are usually associated with a standard ordering of their letters. This makes them useful for purposes of collation, specifically by allowing words to be sorted in alphabetical order. It also means that their letters can be used as an alternative method of "numbering" ordered items, in such contexts as numbered lists." [Alphabet. Wikipedia]
The vector typography example "ABC - Vector stencils library" was created using the ConceptDraw PRO diagramming and vector drawing software extended with the Artwork solution from the Illustration area of ConceptDraw Solution Park.


Bar Chart Examples

Geo Map - Europe - Hungary

This sentence diagram example was redesigned from the Wikipedia file: Examples of Reed-Kellogg diagrams.jpg.
[en.wikipedia.org/ wiki/ File:Examples_ of_ Reed-Kellogg_ diagrams.jpg]
This file is licensed under the Creative Commons Attribution-Share Alike 3.0 Unported license. [creativecommons.org/ licenses/ by-sa/ 3.0/ deed.en]
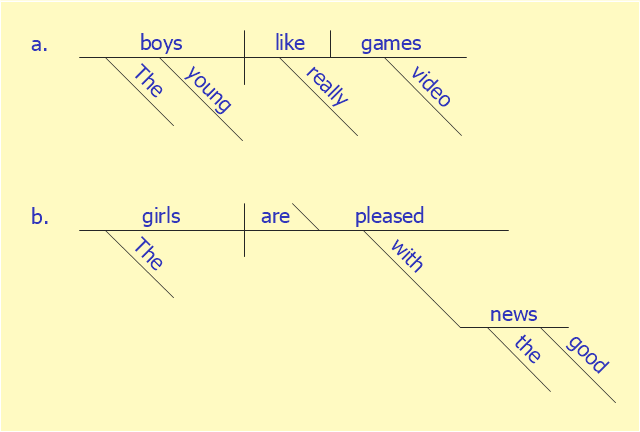
"Most methods of diagramming in pedagogy are based on the work of Alonzo Reed and Brainerd Kellogg in their book Higher Lessons in English, first published in 1877, though the method has been updated with recent understanding of grammar. Reed and Kellogg were preceded, and their work probably informed, by W. S. Clark, who published his "balloon" method of depicting grammar in his 1847 book A Practical Grammar: In Which Words, Phrases & Sentences are Classified According to Their Offices and Their Various Relationships to Each Another.
Some schoolteachers continue to use the Reed-Kellogg system in teaching grammar, but others have discouraged it in favor of more modern tree diagrams. However, these modern tree structures draw on techniques that were already present in Reed-Kellogg diagrams. Reed and Kellogg defend their system in the preface to their grammar:
The Objections to the Diagram. - The fact that the pictorial diagram groups the parts of a sentence according to their offices and relations, and not in the order of speech, has been spoken of as a fault. It is, on the contrary, a merit, for it teaches the pupil to look through the literary order and discover the logical order. He thus learns what the literary order really is, and sees that this may be varied indefinitely, so long as the logical relations are kept clear.
The assertion that correct diagrams can be made mechanically is not borne out by the facts. It is easier to avoid precision in oral analysis than in written. The diagram drives the pupil to a most searching examination of the sentence, brings him face to face with every difficulty, and compels a decision on every point.
These statements bear witness to the fact that Reed-Kellogg diagrams abstract away from actual word order in order to focus more intently on how words in sentences function and relate to each other." [Sentence diagram. Wikipedia]
The examples of Reed-Kellogg diagrams was created using the ConceptDraw PRO diagramming and vector drawing software extended with the Language Learning solution from the Science and Education area of ConceptDraw Solution Park.
[en.wikipedia.org/ wiki/ File:Examples_ of_ Reed-Kellogg_ diagrams.jpg]
This file is licensed under the Creative Commons Attribution-Share Alike 3.0 Unported license. [creativecommons.org/ licenses/ by-sa/ 3.0/ deed.en]
"Most methods of diagramming in pedagogy are based on the work of Alonzo Reed and Brainerd Kellogg in their book Higher Lessons in English, first published in 1877, though the method has been updated with recent understanding of grammar. Reed and Kellogg were preceded, and their work probably informed, by W. S. Clark, who published his "balloon" method of depicting grammar in his 1847 book A Practical Grammar: In Which Words, Phrases & Sentences are Classified According to Their Offices and Their Various Relationships to Each Another.
Some schoolteachers continue to use the Reed-Kellogg system in teaching grammar, but others have discouraged it in favor of more modern tree diagrams. However, these modern tree structures draw on techniques that were already present in Reed-Kellogg diagrams. Reed and Kellogg defend their system in the preface to their grammar:
The Objections to the Diagram. - The fact that the pictorial diagram groups the parts of a sentence according to their offices and relations, and not in the order of speech, has been spoken of as a fault. It is, on the contrary, a merit, for it teaches the pupil to look through the literary order and discover the logical order. He thus learns what the literary order really is, and sees that this may be varied indefinitely, so long as the logical relations are kept clear.
The assertion that correct diagrams can be made mechanically is not borne out by the facts. It is easier to avoid precision in oral analysis than in written. The diagram drives the pupil to a most searching examination of the sentence, brings him face to face with every difficulty, and compels a decision on every point.
These statements bear witness to the fact that Reed-Kellogg diagrams abstract away from actual word order in order to focus more intently on how words in sentences function and relate to each other." [Sentence diagram. Wikipedia]
The examples of Reed-Kellogg diagrams was created using the ConceptDraw PRO diagramming and vector drawing software extended with the Language Learning solution from the Science and Education area of ConceptDraw Solution Park.
Sentence diagram
"Most methods of diagramming in pedagogy are based on the work of Alonzo Reed and Brainerd Kellogg in their book Higher Lessons in English, first published in 1877, though the method has been updated with recent understanding of grammar. ...
Some schoolteachers continue to use the Reed-Kellogg system in teaching grammar, but others have discouraged it in favor of more modern tree diagrams. However, these modern tree structures draw on techniques that were already present in Reed-Kellogg diagrams. Reed and Kellogg defend their system in the preface to their grammar:
The Objections to the Diagram.--The fact that the pictorial diagram groups the parts of a sentence according to their offices and relations, and not in the order of speech, has been spoken of as a fault. It is, on the contrary, a merit, for it teaches the pupil to look through the literary order and discover the logical order. He thus learns what the literary order really is, and sees that this may be varied indefinitely, so long as the logical relations are kept clear.
The assertion that correct diagrams can be made mechanically is not borne out by the facts. It is easier to avoid precision in oral analysis than in written. The diagram drives the pupil to a most searching examination of the sentence, brings him face to face with every difficulty, and compels a decision on every point.
... Reed-Kellogg diagrams abstract away from actual word order in order to focus more intently on how words in sentences function and relate to each other.
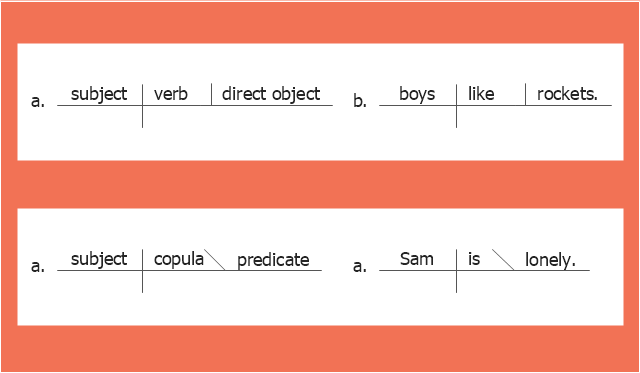
The Reed-Kellogg System. Simple sentences in the Reed-Kellogg system are diagrammed in accordance with the ... basic schemata" shown in this diagram example. [Sentence diagram. Wikipedia]
The example "The Reed-Kellogg system - Basic schemata" was created using the ConceptDraw PRO diagramming and vector drawing software extended with the Language Learning solution from the Science and Education area of ConceptDraw Solution Park.
Some schoolteachers continue to use the Reed-Kellogg system in teaching grammar, but others have discouraged it in favor of more modern tree diagrams. However, these modern tree structures draw on techniques that were already present in Reed-Kellogg diagrams. Reed and Kellogg defend their system in the preface to their grammar:
The Objections to the Diagram.--The fact that the pictorial diagram groups the parts of a sentence according to their offices and relations, and not in the order of speech, has been spoken of as a fault. It is, on the contrary, a merit, for it teaches the pupil to look through the literary order and discover the logical order. He thus learns what the literary order really is, and sees that this may be varied indefinitely, so long as the logical relations are kept clear.
The assertion that correct diagrams can be made mechanically is not borne out by the facts. It is easier to avoid precision in oral analysis than in written. The diagram drives the pupil to a most searching examination of the sentence, brings him face to face with every difficulty, and compels a decision on every point.
... Reed-Kellogg diagrams abstract away from actual word order in order to focus more intently on how words in sentences function and relate to each other.
The Reed-Kellogg System. Simple sentences in the Reed-Kellogg system are diagrammed in accordance with the ... basic schemata" shown in this diagram example. [Sentence diagram. Wikipedia]
The example "The Reed-Kellogg system - Basic schemata" was created using the ConceptDraw PRO diagramming and vector drawing software extended with the Language Learning solution from the Science and Education area of ConceptDraw Solution Park.
Sentence diagram
Geo Map - Canada - Newfoundland and Labrador
- What Is The Most Spoken Language
- Horizontal bar chart - The most spoken languages of the world ...
- Horizontal bar chart - The most spoken languages of the world | Bar ...
- Horizontal bar chart - The most spoken languages of the world
- Horizontal bar chart - The most spoken languages of the world | Bar ...
- Horizontal bar chart - The most spoken languages of the world ...
- Horizontal bar chart - The most spoken languages of the world ...
- Bar Chart Software | Horizontal bar chart - The most spoken ...
- Horizontal bar chart - The most spoken languages of the world ...
- Horizontal bar chart - The most spoken languages of the world
- Bar Graphs | The Most Spoken Language In The World 2014
- Languages of South America - Thematic map | Continent Maps ...
- Languages of South America - Thematic map | Language Learning ...
- Bar Chart Examples | Bar Chart Template for Word | How to Create a ...
- Bar Chart Software | How to Create a Bar Chart | How to Create a ...
- Languages of South America - Thematic map | Visualization Spatial ...
- Languages of South America - Thematic map | South America ...
- Brazil in South America map | Languages of South America map
- What Is Bar Chart Example And Solution