This SWOT matrix diagram example was created on the base of article "An Easy Way To Jumpstart Your Strategic Plan: SWOT" by Leslie Wolf from the website of the California Digital Library, the University of California. "Strategic planning doesn’t have to be a daunting and lengthy process. The goal is really a simple one: to help you understand your world and build a road map to guide your efforts. ...
This analysis tool can help you focus your attention on the specific success factors that are right for your team.
The tool is called a SWOT analysis. SWOT stands for Strengths and Weaknesses, Opportunities and Threats. Here’s what it means:
(1) Strengths are those positive internal attributes that strengthen your business or team. You can develop plans to capitalize on those strengths.
(2) Weaknesses are those negative internal attributes that are working against your success. You can shore up those weaknesses so they don’t stop your success.
(3) Opportunities are those external conditions that can have a positive effect on your goals. These opportunities can point you in the right direction.
(4) Threats are those external conditions that can have a negative effect on your goals. These threats will affect you less if you can identify and minimize them. ...
We thought it would be helpful to show you a sample SWOT analysis for a business you can easily visualize: a small independent bookstore in a university town. The store owner brought the team together to think about how the bookstore could survive during the continuing financial downturn. After an hour of brainstorming, this is the SWOT analysis they developed." [cdlib.org/ cdlinfo/ 2010/ 09/ 29/ an-easy-way-to-jumpstart-your-strategic-plan-swot/ ]
The matrix diagram example "SWOT analysis for a small independent bookstore" was created using the ConceptDraw PRO diagramming and vector drawing software extended with the SWOT Analysis solution from the Management area of ConceptDraw Solution Park.
HelpDesk
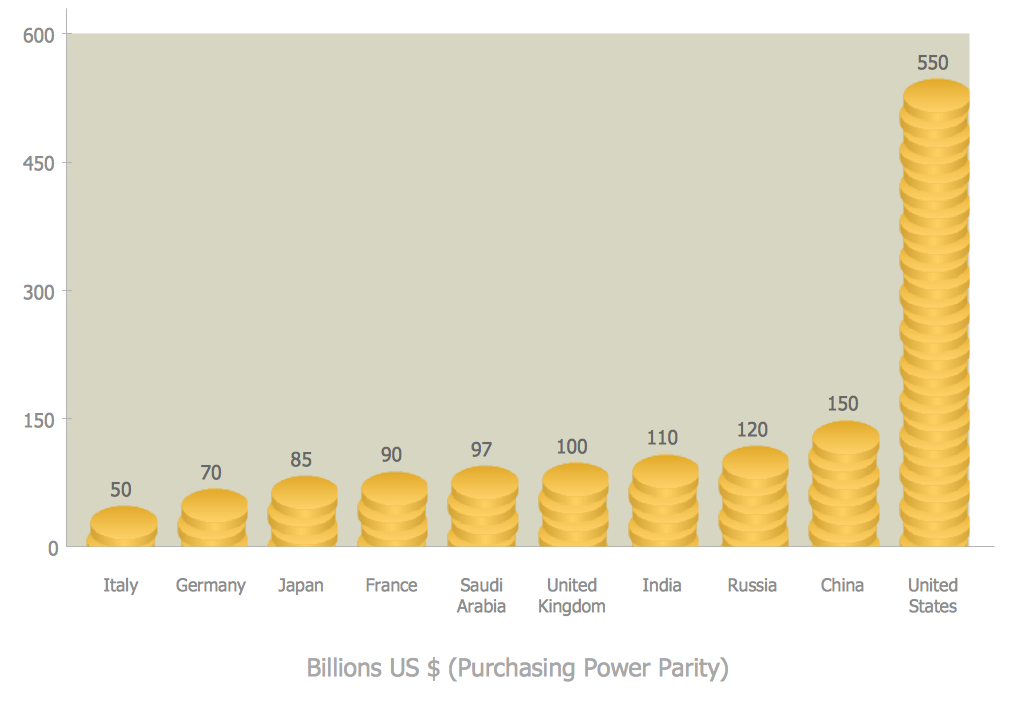
How to Create a Picture Graph in ConceptDraw PRO
Picture Graphs are used commonly to represent non-complex data to a large audience. A Picture Graph is simple kind of marketing diagram used to show the relationship among various quantities. It include pictures or symbols to represent information visually. There are many cases when you have just some numbers to show and compare. This is not a reason to not use visual tools. You can produce a simple picture graph using memorable symbols to get the best visual presentation. Using specific symbols instead of regular colored bars makes picture graphs a much more descriptive tool. You can use tools from an existing library or find appropriate clipart in ConceptDraw’s collection. ConceptDraw PRO allows you to draw a simple and easy to understand Graph Charts using the special library.HelpDesk
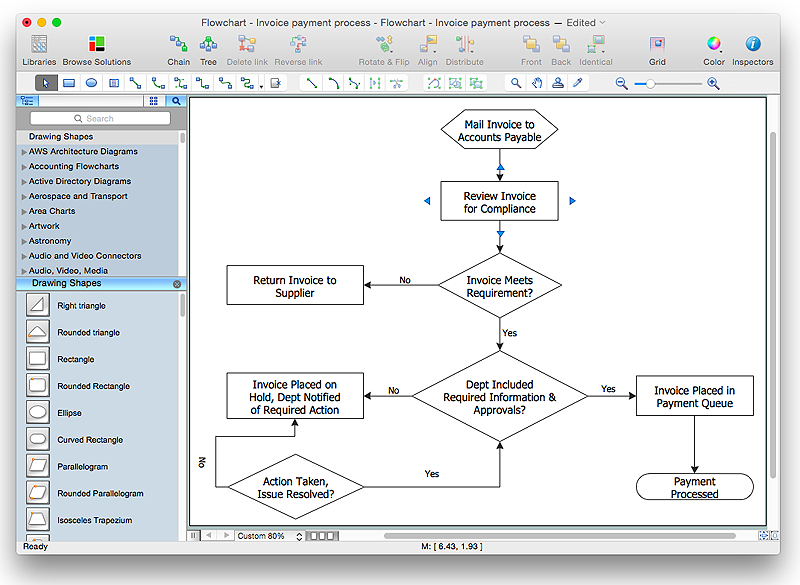
How to Simplify Flow Charting in ConceptDraw PRO on OS X
Flowchart is a great way to present any complex process in a simple to understand manner. Flowchart is perhaps the most common form of diagrams used in both technical and social fields. Since a flow chart is a method that allows to describe visually any consequent process, it can be used to show the flow of logic of any process. In ConceptDraw PRO it really is simple to draw even the most complex flowcharts. Use the RapidDraw technology for the best results.HelpDesk
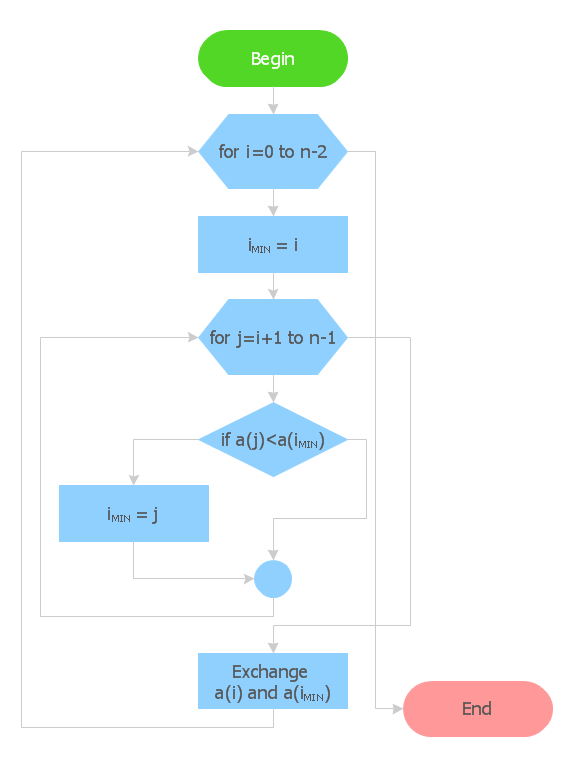
How to Create Flowchart Using Standard Flowchart Symbols
Flowcharts are used to display an algorithm for consistent execution of certain steps. Flowchart is probably the easiest way to make a graphical representation of any process. Flowcharts use the set of standard geometric symbols and arrows to define relationships. ConceptDraw PRO allows you to create professional flowchart quickly and easily. The ability to create flowcharts is contained in the Flowcharts solution. The solution provides a set of special tools for creating flowcharts.
 SYSML
SYSML
The SysML solution helps to present diagrams using Systems Modeling Language; a perfect tool for system engineering.
HR Flowchart Symbols
Human resources are the people who make up the employee workforce of an organization or company. Human resource management has four basic functions: staffing, motivation, training and development, and maintenance. It is convenient to use the flowcharts to represent various HR processes and workflows. ConceptDraw PRO diagramming and vector drawing software extended with HR Flowcharts solution from the Management area of ConceptDraw Solution Park supplies you with comprehensive selection of predesigned vector HR flowchart symbols and standardized flowchart notation symbols, which allow you to design effectively the eye-catching infographics and diagrams relating to any human resource management process that will be relevant and understood by all business associates. The ConceptDraw PRO software offers also the set of predesigned flowchart and workflow templates and samples making your drawing process as easy as possible. Use the HR Flowcharts solution to create professional-looking HR Flowcharts and HRM Business Process Diagrams in a matter of moments.Organizational Chart
An organizational chart is a diagram that shows the structure of an organization and the relationships of its parts. ConceptDraw PRO extended with Organizational Charts Solution from the Management Area is powerful Organizational Chart Software.
 Illustration
This solution extends ConceptDraw PRO v9.4, allowing you to make professional-looking documents, presentations and websites illustrated with color, scalable vector clip art and shapes, regardless of drawing skills.
HelpDesk
How to Draw an Organizational Chart Using ConceptDraw PRO
The organizational chart software is a valuable tool for modern business. It is important for any business to build a clear organizational structure that determines the responsibilities and relationships between different positions in the organization. The clear structured organization - means the clear structured business workflow, which is the core of success in the business. ConceptDraw PRO is an org chart software that allows you to draw an organizational structure of your company quickly and easily.ConceptDraw PRO 9 Comparison with Omnigraffle Professional and MS Visio
ConceptDraw PRO comparison with Omnigraffle Professional and MS Visio shows you the significant benefits of ConceptDraw PRO, which offers varied useful drawing tools, the capability of creation multi-page documents, wide export / import capabilities in graphic formats, integration with Visio and Microsoft Office applications, availability of built-in scripting language and ConceptDraw Solution Park with numerous solutions, vector objects libraries, templates and samples. Business today is conducted with incredible rate and dynamic presentations become very popular. Sometimes while conducting the business, may happen that you can't describe some situation, state, or process with only words. In these cases it is convenient to include graphics and diagrams associated with the text. This guarantees successful communication with other stakeholders and team members, and faultless understanding the information by them. The combination of words and graphics is ideal combination, it improves the clarity and removes any doubt. ConceptDraw PRO helps you easy create any kinds of diagrams and dynamic presentations too.HelpDesk
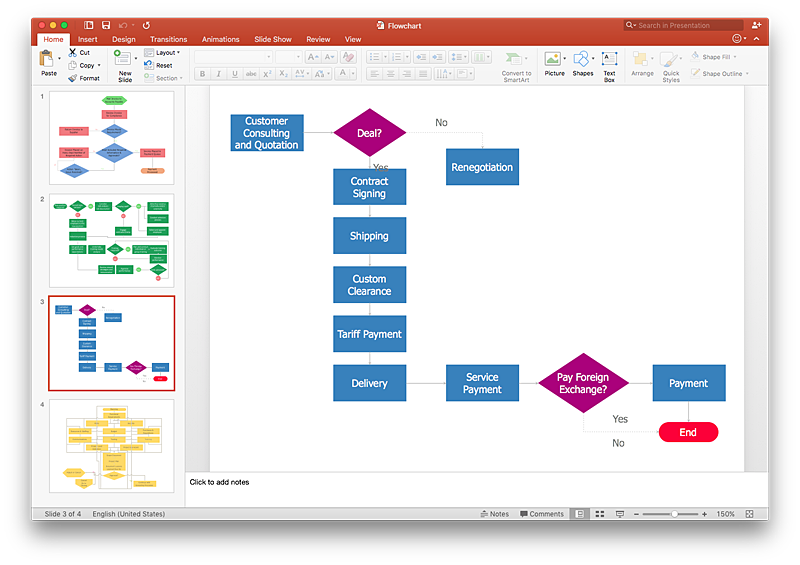
How To Make a PowerPoint Presentation of Flowcharts Using ConceptDraw PRO
ConceptDraw PRO allows you to create professional flowchart quickly and easily. The ability to create flowcharts is contained in the Flowcharts solution. To submit flowcharts for the audience, you can use export to MS PowerPoint.
 Wireless Networks
The Wireless Networks Solution extends ConceptDraw PRO software with professional diagramming tools to help network engineers and designers efficiently design and create wireless network diagrams that illustrate wireless networks of any speed and complexity.
 Baseball
The Baseball Solution extends ConceptDraw PRO v9.5 (or later) software with samples, templates, and libraries of vector objects for drawing baseball diagrams, plays, and illustrations. It can be used to make professional looking documents, presentations,
HelpDesk
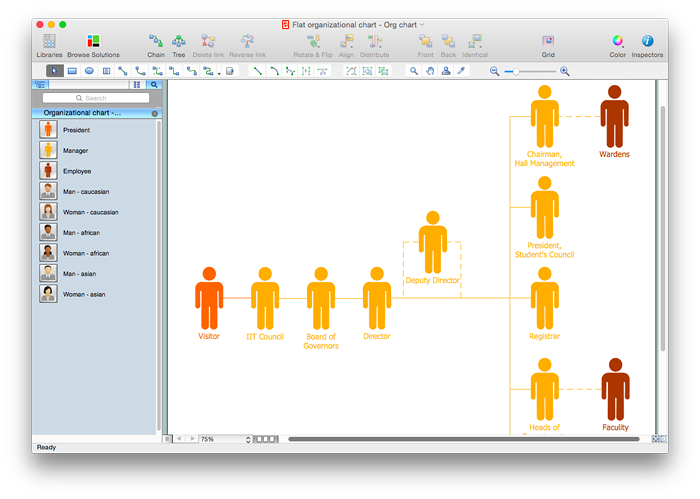
How to Draw a Flat Organizational Chart with ConceptDraw PRO
A clear organizational chart helps you to understand the relationships of positions in an organization in terms of authority and responsibility. A Flat organizational structure is one of the most typical organizational structure. Use The Flat Organizational chart template to draw an organizational structure of your company. ConceptDraw 25 Typical Orgcharts solution provides you with the possibility to develop typical organizational charts quickly and easily.
 Landscape & Garden
The Landscape and Gardens solution for ConceptDraw PRO v10 is the ideal drawing tool when creating landscape plans. Any gardener wondering how to design a garden can find the most effective way with Landscape and Gardens solution.
 Audit Flowcharts
Audit flowcharts solution extends ConceptDraw PRO software with templates, samples and library of vector stencils for drawing the audit and fiscal flow charts.
 Entity-Relationship Diagram (ERD)
Entity-Relationship Diagram (ERD) solution extends ConceptDraw PRO software with templates, samples and libraries of vector stencils from drawing the ER-diagrams by Chen's and crow’s foot notations.
 Language Learning
Language Learning solution extends ConceptDraw PRO software with templates, samples and library of vector stencils for drawing the sentence diagrams.
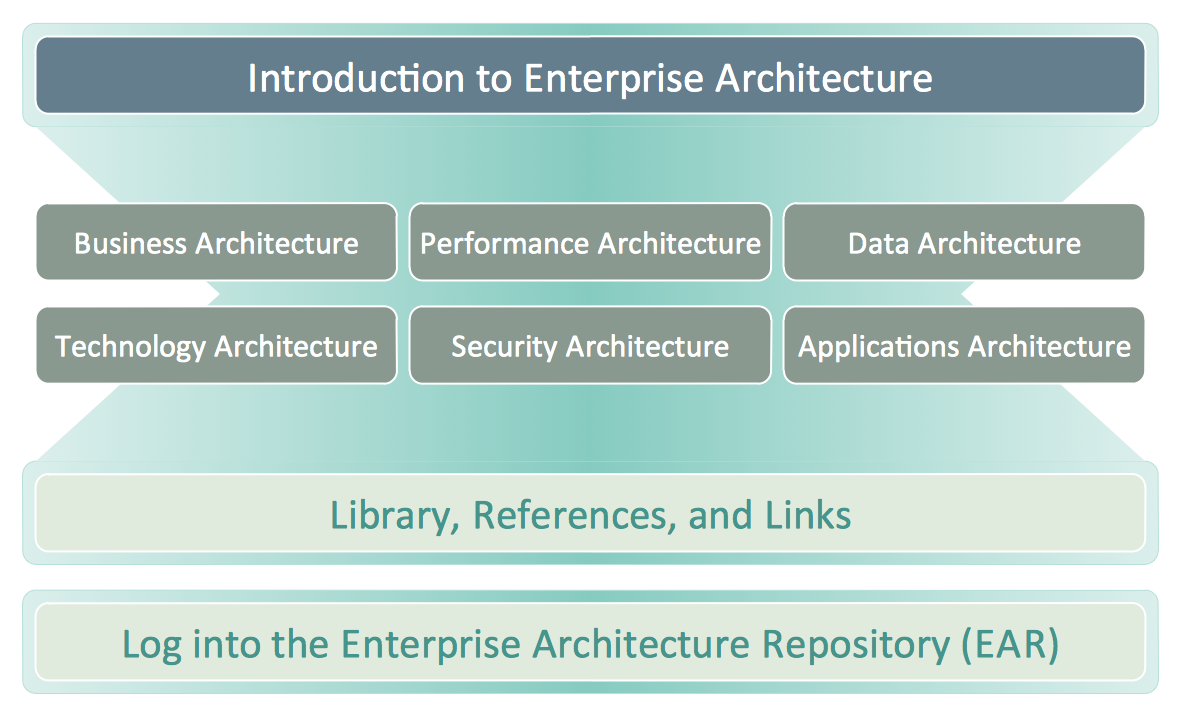
Business Architecture
ConceptDraw PRO is a powerful diagramming and vector drawing software. Supplied with Enterprise Architecture Diagrams Solution from the Management Area, ConceptDraw PRO is ideal for construction the Business Architecture Diagrams.
 Bar Graphs
The Bar Graphs solution enhances ConceptDraw PRO v10 functionality with templates, numerous professional-looking samples, and a library of vector stencils for drawing different types of Bar Graphs, such as Simple Bar Graph, Double Bar Graph, Divided Bar Graph, Horizontal Bar Graph, Vertical Bar Graph, and Column Bar Chart.
- SWOT analysis for a small independent bookstore | SWOT and ...
- SWOT Matrix Template | SWOT Analysis | SWOT analysis for a small ...
- Basic Workflow Examples | Floor Plans | Tools - Vector stencils ...
- SWOT analysis for a small independent bookstore | How to Make ...
- SWOT Matrix Template | SWOT analysis matrix diagram templates ...
- SWOT Analysis | SWOT Matrix Template | SWOT and TOWS Matrix ...
- SWOT analysis for a small independent bookstore | Office Layout ...
- SWOT and TOWS Matrix Diagrams | SWOT Analysis | SWOT ...
- SWOT Matrix Software | SWOT Sample in Computers | SWOT ...
- SWOT Analysis Solution - Strategy Tools | SWOT Analysis | SWOT ...
- SWOT Analysis Solution - Strategy Tools | Matrices | Ansoff's product ...
- SWOT Analysis Solution - Strategy Tools | SWOT Analysis Tool for ...
- SWOT Analysis | Matrices | SWOT analysis for a small independent ...
- Sample Swot Analysis Of A Company
- SWOT Analysis | SWOT and TOWS Matrix Diagrams | SWOT ...
- Fault Tree Analysis Diagrams | Fishbone Diagram | Structured ...
- Appliances - Vector stencils library | Using Fishbone Diagrams for ...
- SWOT Analysis | SWOT analysis for a small independent bookstore ...
- SWOT Analysis | Mechanical Engineering | SWOT Analysis | Give ...
- SWOT analysis for a small independent bookstore | Mind Maps for ...

