 ConceptDraw Solution Park
ConceptDraw Solution Park collects graphic extensions, examples and learning materials
HelpDesk
How to Create a Timeline Diagram in ConceptDraw PRO

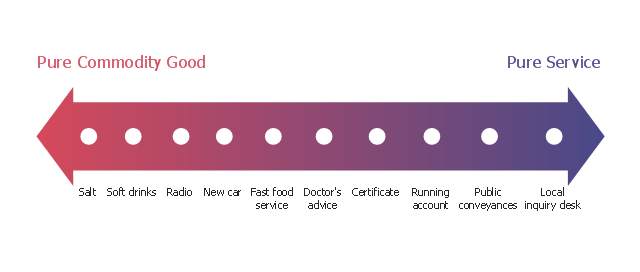
"The dichotomy between physical goods and intangible services is an oversimplification; these are not discrete categories. Most business theorists see a continuum with pure service at one endpoint and pure commodity goods at the other endpoint. Most products fall between these two extremes. Goods are normally structural and can be transferred in an instant while services are delivered over a period of time. Goods can be returned while a service once delivered cannot. Goods are not always tangible and may be virtual." [Goods and services. Wikipedia]
The example "Service-goods continuum diagram" was created using the ConceptDraw PRO diagramming and vector drawing software extended with the Marketing Diagrams solution from the Marketing area of ConceptDraw Solution Park.
The example "Service-goods continuum diagram" was created using the ConceptDraw PRO diagramming and vector drawing software extended with the Marketing Diagrams solution from the Marketing area of ConceptDraw Solution Park.
Service-goods continuum
 Entity-Relationship Diagram (ERD)
Entity-Relationship Diagram (ERD) solution extends ConceptDraw PRO software with templates, samples and libraries of vector stencils from drawing the ER-diagrams by Chen's and crow’s foot notations.
 Event-driven Process Chain Diagrams
Event-driven Process Chain (EPC) Diagram is a type of flowchart widely used for modeling in business engineering and reengineering, business process improvement, and analysis. EPC method was developed within the Architecture of Integrated Information Systems (ARIS) framework.
- Marketing Diagrams | Entity-Relationship Diagram (ERD) | Process ...
- Marketing Diagrams | Marketing | Flowchart Marketing Process ...
- Flowchart Marketing Process. Flowchart Examples | Process ...
- Pyramid Chart Examples | Diagrams Of Branded Goods
- Service Marketing Diagram
- What Do You Mean By Flow Chart
- Marketing Diagrams | Marketing Area | Target and Circular ...
- Service-goods continuum diagram | Block diagram - Porter's five ...
- Customer Marketing Diagram
- Explain With Suitable Examples And A Flow Chart The Concept Of
- ConceptDraw PRO ER Diagram Tool | Flow Diagram Software ...
- 4 Level pyramid model diagram - Information systems types | 5 Level ...
- Wit The Aid Of A Diagram Describe Three Areas That Service
- Marketing Is A Process Explain With Suitable Examples And A Flow
- ConceptDraw PRO ER Diagram Tool | Flow Diagram Software ...
- In Marketing Draw A Diagram Of A Market
- The Circular Flow Diagram | Circular Arrows Diagrams | Basic ...
- Strategy Diagram Or Concept
- Diagram To Define Marketing
- Process Flowchart | Basic Flowchart Symbols and Meaning | Types ...