 Fishbone Diagram
Fishbone Diagrams solution extends ConceptDraw DIAGRAM software with templates, samples and library of vector stencils for drawing the Ishikawa diagrams for cause and effect analysis.
Fishbone Diagram Template

How to Help Customers be More Productive
Cause and Effect Fishbone Diagram

 PM Docs
PM Docs solution from ConceptDraw Solution Park extends ConceptDraw MINDMAP software with the ability to create and organize the project and company documentation, to structure information that relates to your project, to link the project documentation to tasks, phases, and resources. This solution contributes for improvement the project management abilities and enhancement the productivity of project team, makes it easier to locate the pertinent documentation over the life of a project, beginning from its planning, improves the document access and minimizes search time, lets to link or embed documentation into the project topics, helps create document, design professional Mind Maps, link the correct documents to keep them organized in a project, sort the project documents and visually differentiate the document types.
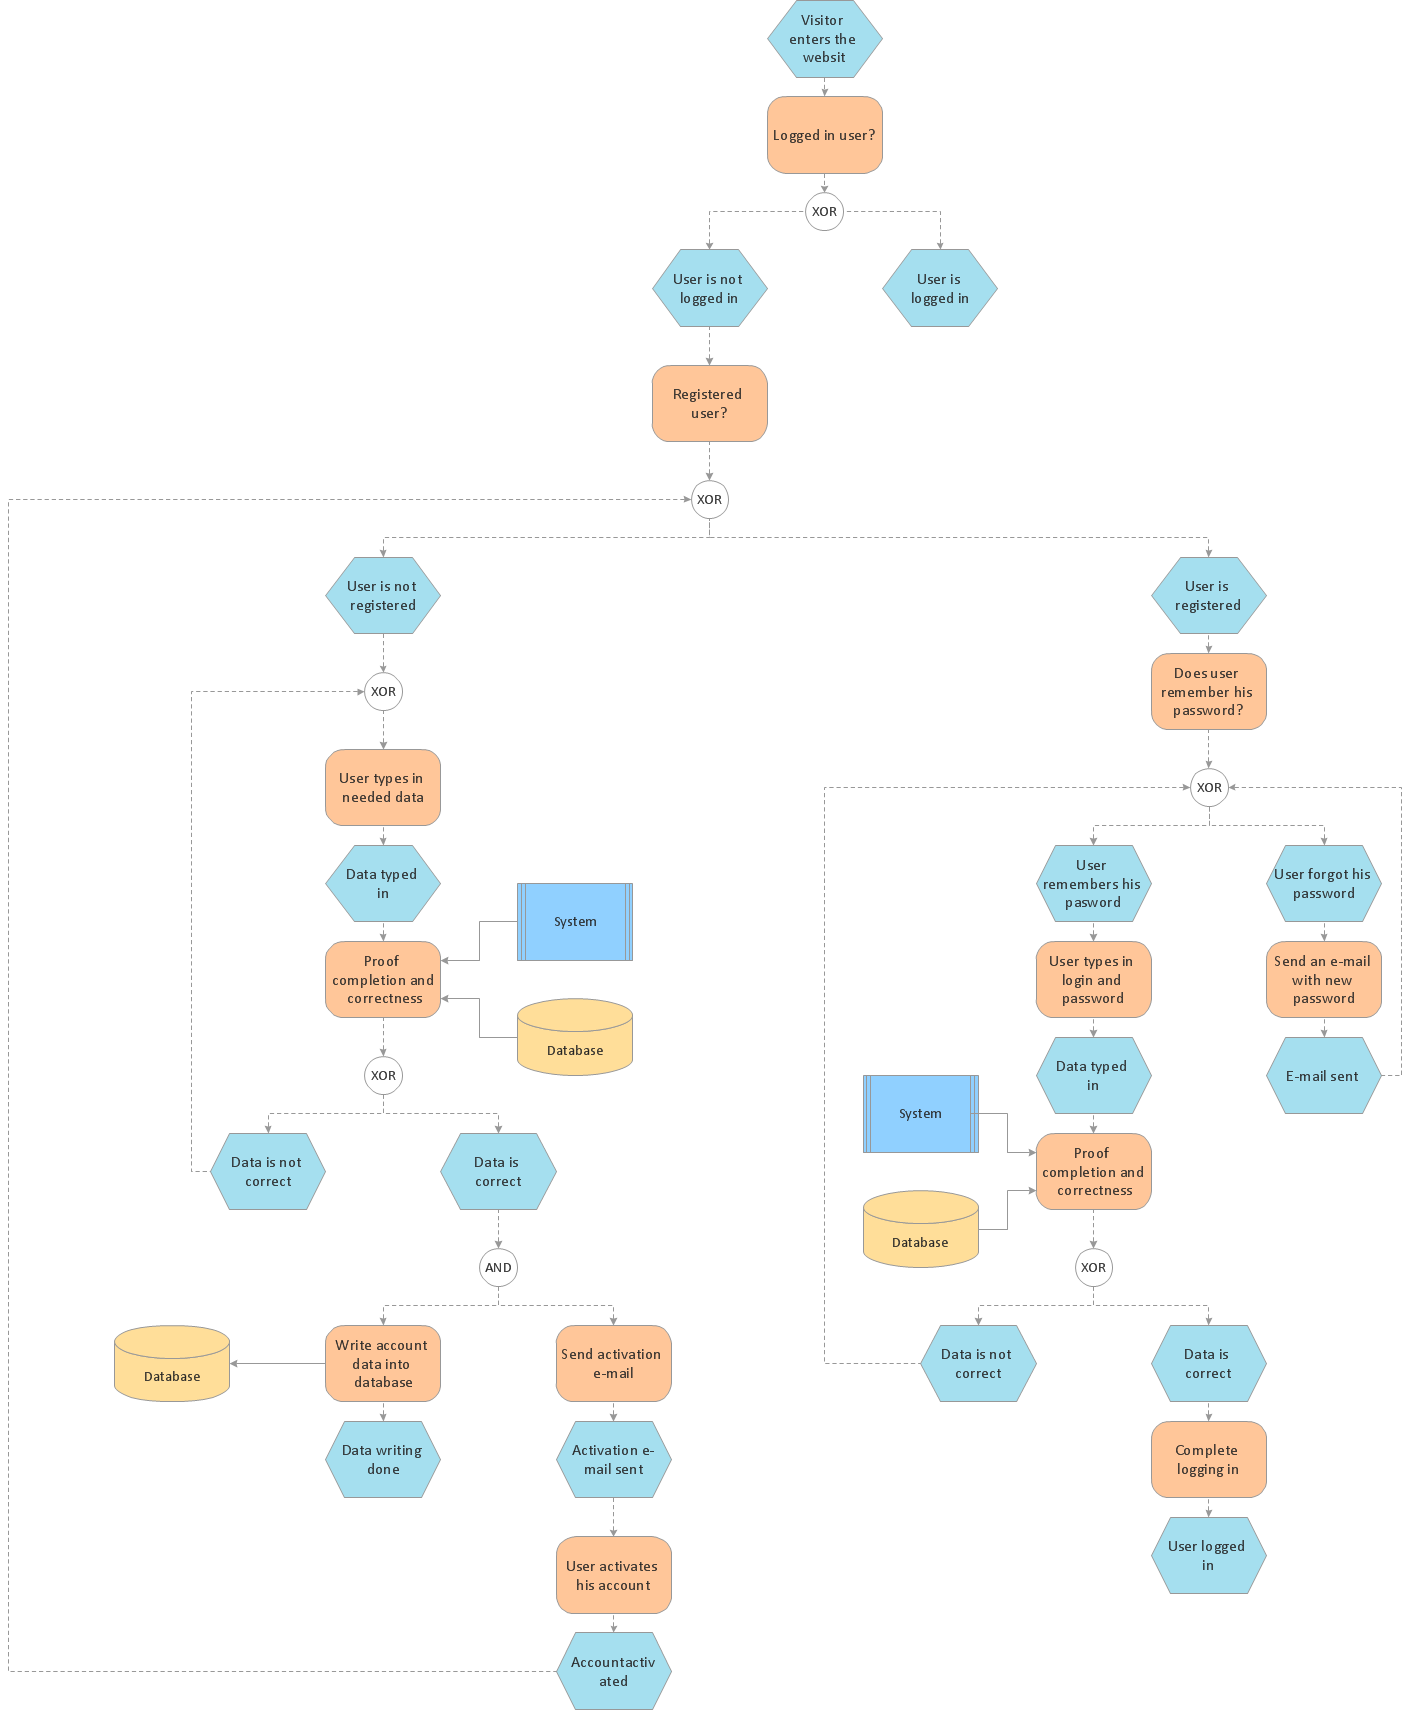
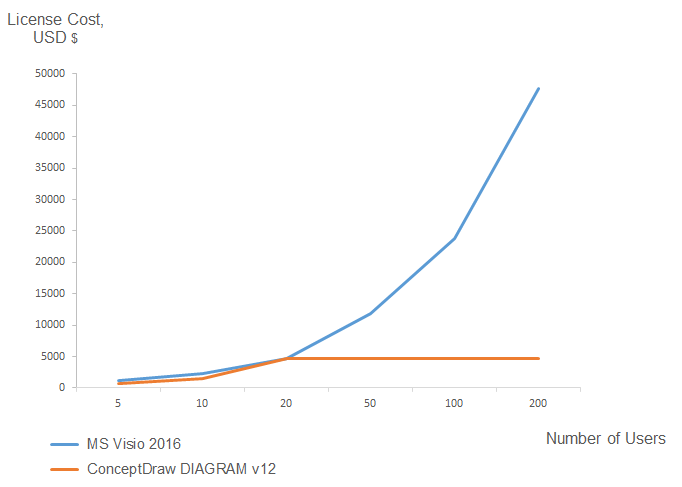
ConceptDraw DIAGRAM Compatibility with MS Visio

How Do Fishbone Diagrams Solve Manufacturing Problems

 Fishbone Diagrams
The Fishbone Diagrams solution extends ConceptDraw DIAGRAM software with the ability to easily draw the Fishbone Diagrams (Ishikawa Diagrams) to clearly see the cause and effect analysis and also problem solving. The vector graphic diagrams produced using this solution can be used in whitepapers, presentations, datasheets, posters, and published technical material.
HelpDesk
Replace Your Current Diagramming Tool
 PM Meetings
PM Meetings solution extends ConceptDraw MINDMAP software with special tools, features, and templates, making the preparation for meetings of different orientation a quick and simple task, and allowing the project managers, team leaders, management specialists, and meeting organizers the capability to prepare easily and quickly for regular project meetings using solution's templates, to brainstorm ideas, to record brainstorming results, to keep the meetings on track, and to share meeting results immediately and without efforts. The meetings become more efficient because of the ability to easily record results, the collaborative team decisions are captured as a part of the meeting process, the meeting notes are easily distributed at a meeting’s conclusion to all participants and stakeholders.
Create Fishbone Diagrams

Successful Strategic Plan

HR Management Software

How To Plan and Implement Projects Faster

- Manufacturing 8 Ms fishbone diagram - Template | How Do ...
- How Do Fishbone Diagrams Solve Manufacturing Problems ...
- Manufacturing 8 Ms fishbone diagram - Template | When To Use a ...
- Manufacturing 8 Ms fishbone diagram - Template | Total Quality ...
- 8 Ms Of Management
- Manufacturing 8 Ms fishbone diagram - Template | How Do ...
- Manufacturing 8 Ms fishbone diagram - Template | Cause And Effect ...
- Manufacturing 8 Ms fishbone diagram - Template | Fishbone ...
- Using Fishbone Diagrams for Problem Solving | Fishbone Diagram ...
- Total Quality Management with ConceptDraw | Manufacturing 8 Ms ...
- Business Productivity - Management | In searching of alternative to ...
- 4 Ms fishbone diagram - Production process | Manufacturing 8 Ms ...
- Total Quality Management Value | Manufacturing 8 Ms fishbone ...
- Manufacturing 8 Ms fishbone diagram - Template | Management ...
- Manufacturing 8 Ms fishbone diagram - Template | Cause and Effect ...
- How to Construct a Fishbone Diagram | Total Quality Management ...
- Manufacturing 8 Ms fishbone diagram - Template | How Do ...
- 8 Ms Of Business
- How Do Fishbone Diagrams Solve Manufacturing Problems ...
- 4 Ms fishbone diagram - Production process | Total Quality ...