Business diagrams & Org Charts with ConceptDraw DIAGRAM
The business diagrams are in great demand, they describe the business processes, business tasks and activities which are executed to achieve specific organizational and business goals, increase productivity, reduce costs and errors. They let research and better understand the business processes. ConceptDraw DIAGRAM is a powerful professional cross-platform business graphics and business flowcharting tool which contains hundreds of built-in collections of task-specific vector stencils and templates. They will help you to visualize and structure information, create various Business flowcharts, maps and diagrams with minimal efforts, and add them to your documents and presentations to make them successful. Among them are Data flow diagrams, Organization charts, Business process workflow diagrams, Audit flowcharts, Cause and Effect diagrams, IDEF business process diagrams, Cross-functional flowcharts, PERT charts, Timeline diagrams, Calendars, Marketing diagrams, Pyramids, Target diagrams, Venn diagrams, Comparison charts, Analysis charts, Dashboards, and many more. Being a cross-platform application, ConceptDraw DIAGRAM is very secure, handy, free of bloatware and one of the best alternatives to Visio for Mac users.
Garrett IA Diagrams with ConceptDraw DIAGRAM
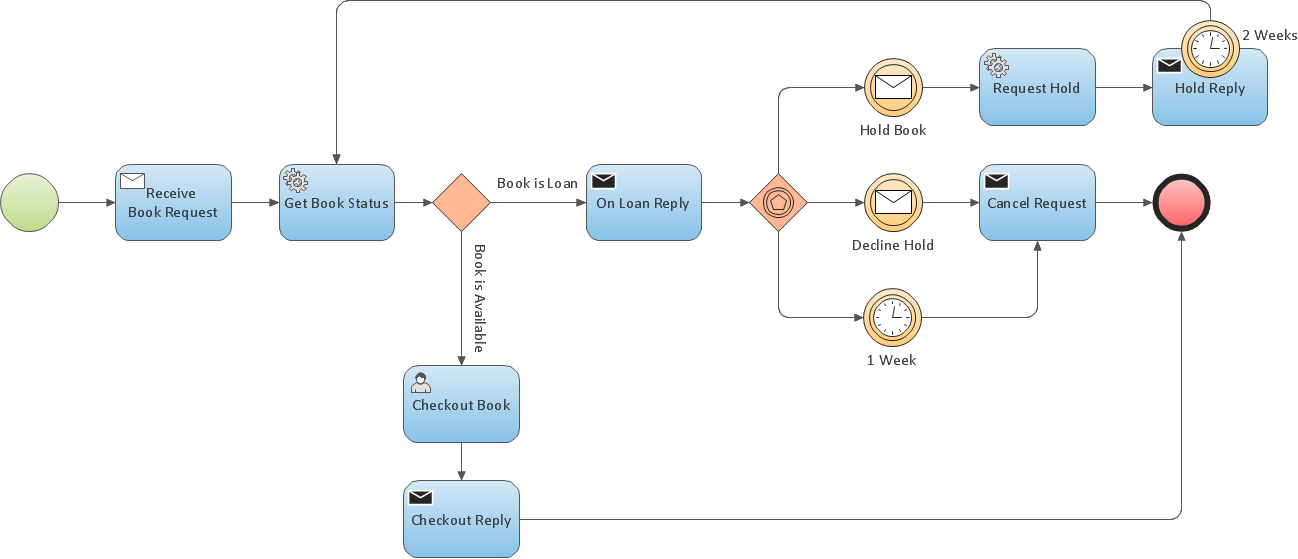
Garrett IA diagrams are used at development of Internet-resources, in particulars at projecting of interactions of web-resource elements. The diagram of information architecture of the web resource which is constructed correctly with necessary details presents to developers the resource in comprehensible and visual way.Business Process Modeling Resume
ConceptDraw DIAGRAM is a best business processes modeling software for graphical documenting processes of the company.
 Histograms
How to make a Histogram? Making a Histogram is an incredibly easy process when it is done with ConceptDraw DIAGRAM. The Histograms Solution enhances ConceptDraw DIAGRAM functionality with extensive drawing tools, numerous samples, and examples; also a quick-start template and library of ready vector stencils for visualization the data and professional drawing Histograms.
 Infographics Area
Solutions of the area What is Infographics from ConceptDraw Solution Park collect templates, samples and vector stencils libraries with design elements for the drawing information graphics.
 Fishbone Diagram
Fishbone Diagrams solution extends ConceptDraw DIAGRAM software with templates, samples and library of vector stencils for drawing the Ishikawa diagrams for cause and effect analysis.
 Composition Dashboard
Composition dashboard solution extends ConceptDraw DIAGRAM software with templates, samples and vector stencils library with charts and indicators for drawing visual dashboards showing data composition.
- Accounting Flowcharts | Example Process Flow | How To Create a ...
- Example Process Flow | Accounting Flowcharts | Flowchart ...
- Example Process Flow | Accounting Flowcharts | Best Program to ...
- Audit flowchart - Project management process | Audit Flowcharts ...
- Accounting Flowcharts | Example Process Flow | Flowcharts |
- Design elements - Accounting flowcharts | Basic Flowchart Symbols ...
- Audit flowchart - Project management process | Audit flowchart (two ...
- Basic Flowchart Symbols | Illustration | Currency - Design Elements |
- Basic Flowchart Symbols | Flow Chart Symbols | Flowchart Symbols ...
- Algorithm flowchart - Selection sorting method | Flowcharts | Process ...
- Data Flow Diagrams | Visio Files and ConceptDraw | Process ...
- Data Flow Diagrams | Applications | Flowchart Software |
- Audit Flowcharts | Audit process flowchart (multipage) | Audit ...
- Example Process Flow | How To Create a FlowChart using ...
- Types of Flowchart - Overview | Basic Flowchart Symbols | Total ...
- Applications | Create Graphs and Charts | Good Flow Chart app for ...
- Data flow diagram template
- Flowchart - Website launch | Best Program to Create a Fowchart ...
- Accounting Flowcharts | Example Process Flow | How To Create a ...
- Business diagrams & Org Charts with ConceptDraw PRO | Flowchart ...


