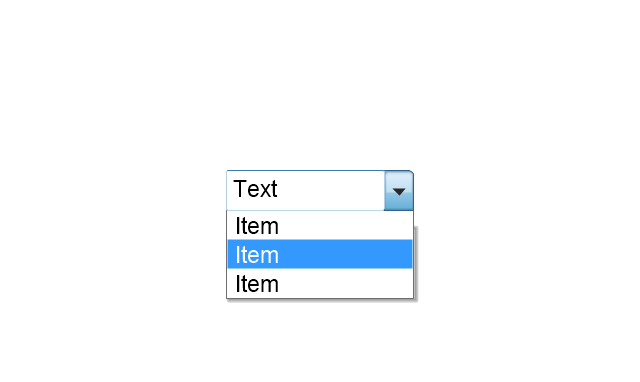
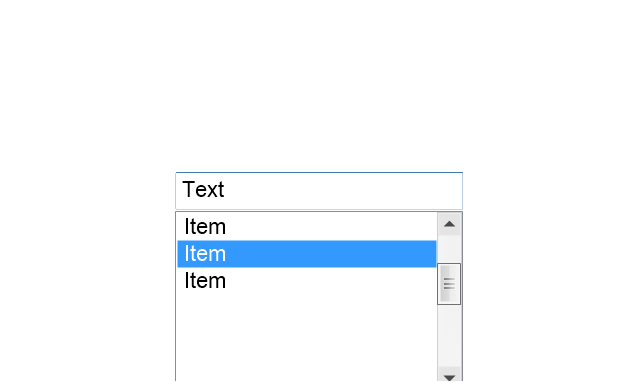
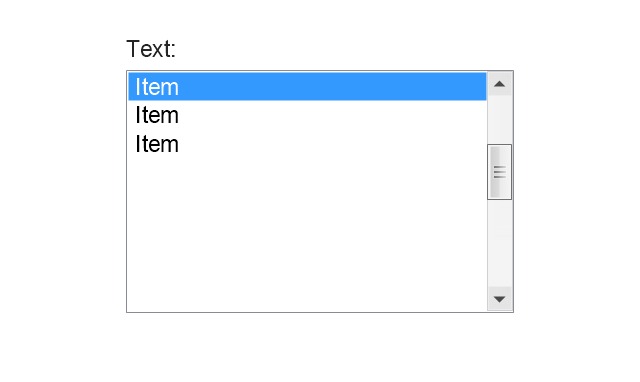
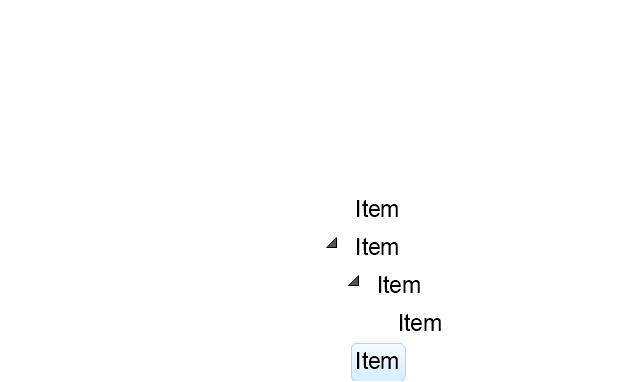
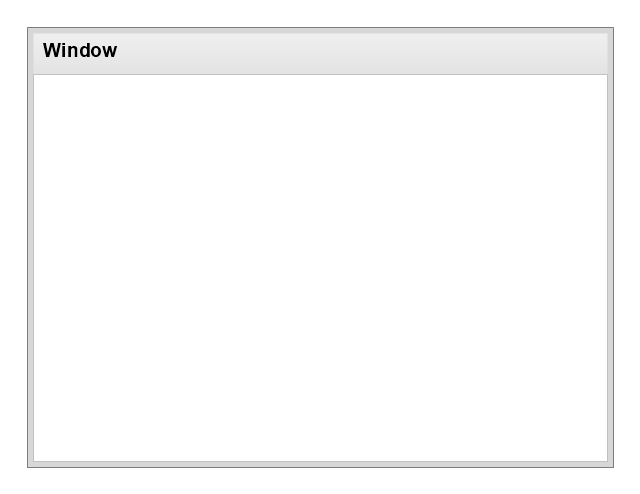
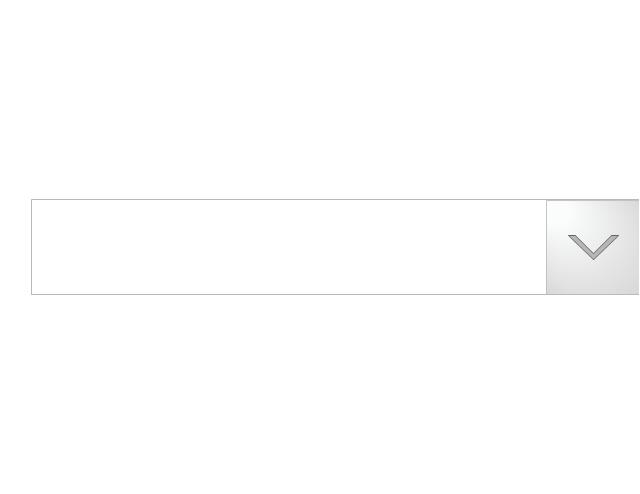
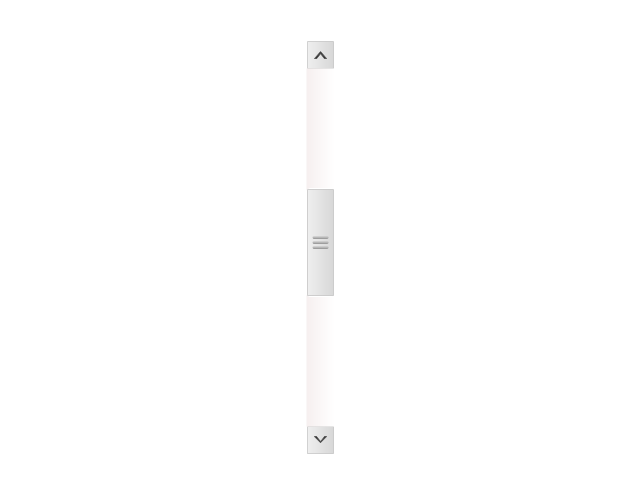
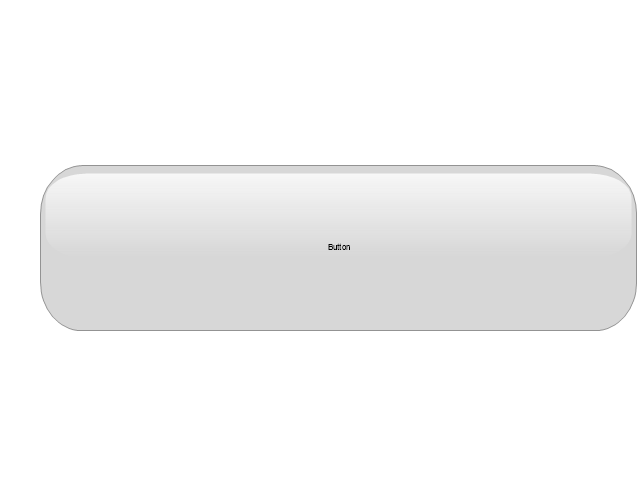
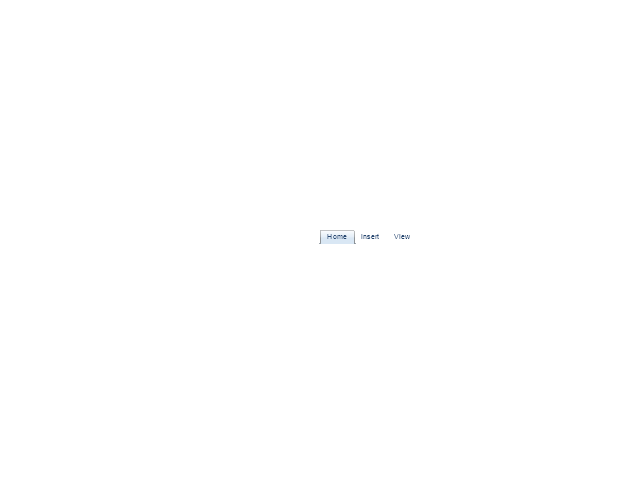
The vector stencils library "MS Windows Vista user interface" contains 76 MS Windows Vista design elements.
Use it for designing Microsoft ribbon graphic user interface (GUI) of software for computers with MS Windows Vista OS in the ConceptDraw PRO diagramming and vector drawing software extended with the Graphic User Interface solution from the Software Development area of ConceptDraw Solution Park.
Use it for designing Microsoft ribbon graphic user interface (GUI) of software for computers with MS Windows Vista OS in the ConceptDraw PRO diagramming and vector drawing software extended with the Graphic User Interface solution from the Software Development area of ConceptDraw Solution Park.
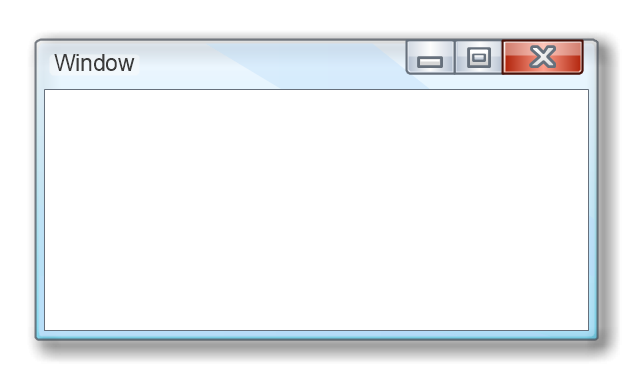
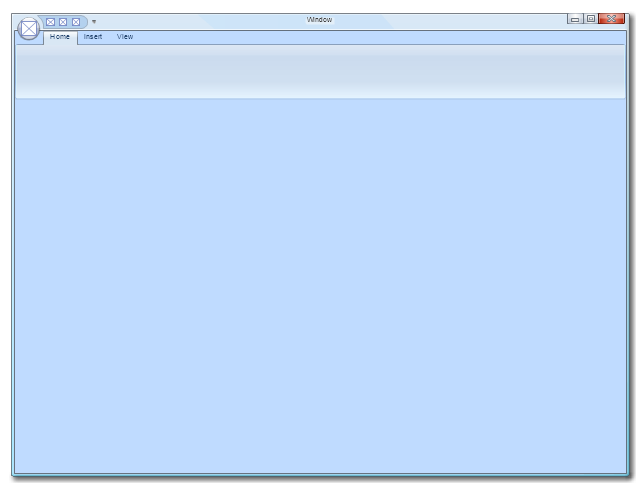
Window
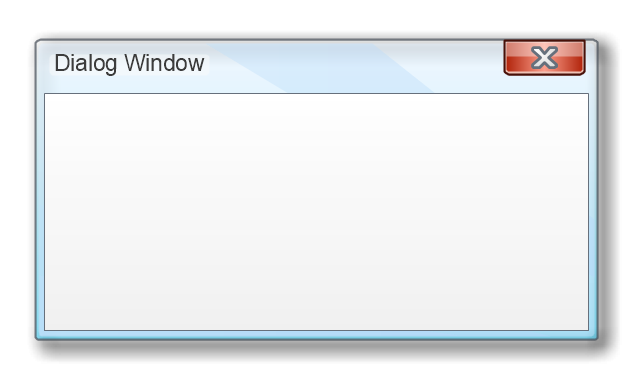
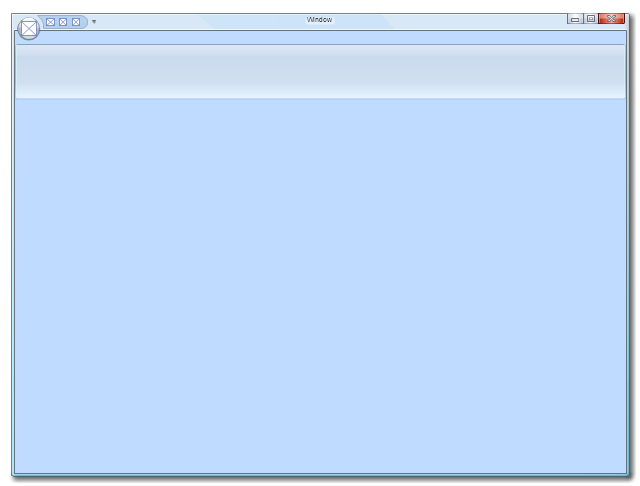
Dialog Window
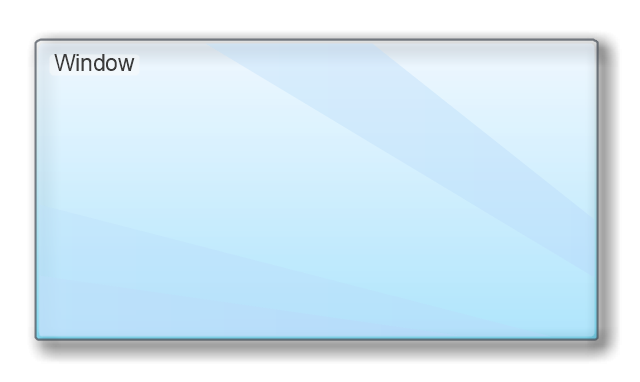
Empty Window
Field

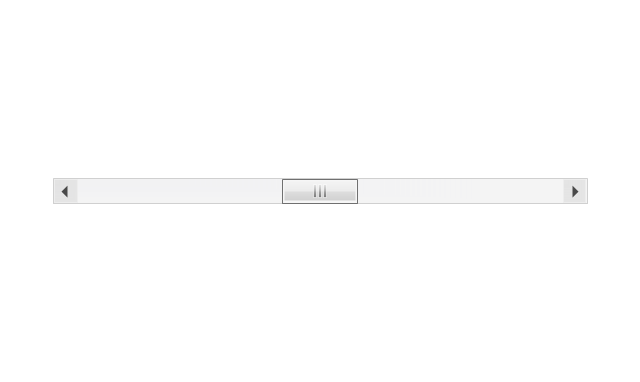
Horizontal Scrollbar
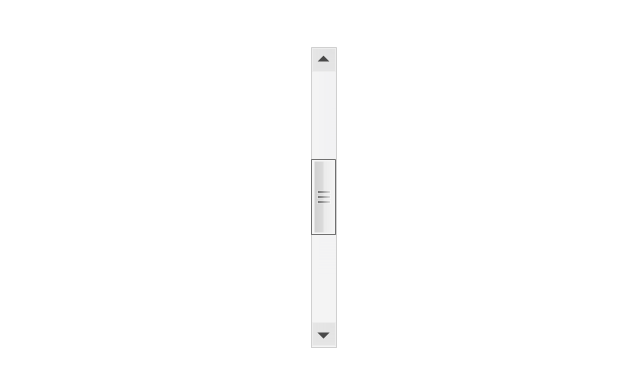
Vertical Scrollbar
Window Buttons
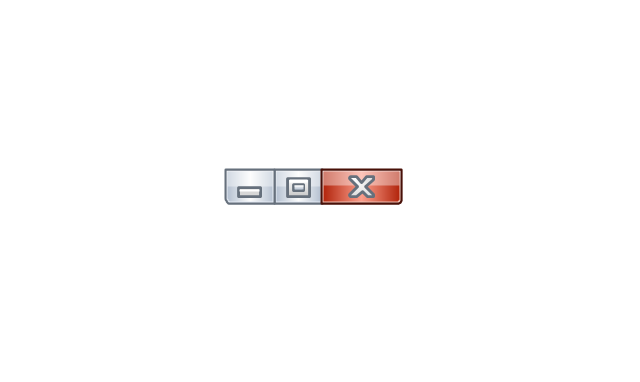
Window Buttons
Window Button 1

Window Button 2

Window Button 3
Window Button 4

Navigation

Menu Bar
Gradient Menu Bar
Drop-down Menu
Button
Toolbar Pannel
Tool Button
Primary Toolbar

Toolbar 1
Toolbar 2
Customizable Tollbar
Tab View
List View
Text Field
Vertical Separator

Horizontal Separator

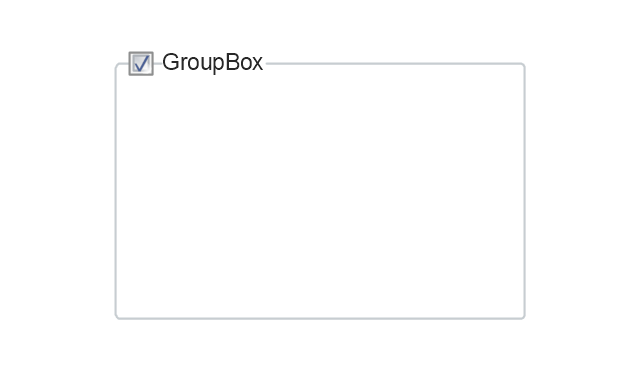
Group Box
Text Label

Link

Line Edit
Search

Search with Button

Spin Box
Combo-box
Editable Combo-box
Editable List Box
List Box
Single-selection List
Multiple-selection List
Check Box
Radio Button
Check box group
Radio Buttons Group
Progress Bar

Modal Progress Bar

Vertical Slider with Ticks
Horizontal Slider with Ticks
Dial

Catalogue Tree
Tree View 1
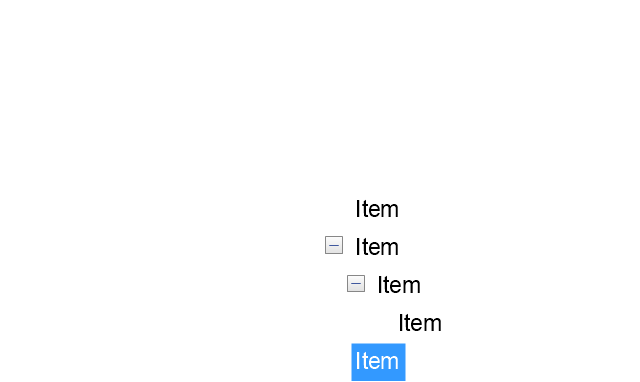
Tree View 2
Vertical Spacer
Horizontal Spacer
Chevron 1
Arrow 1
Arrow 2
Plus/Minus Control
Rotating Triangle

Chevron 3
Chevron 2
Normal Select Cursor

Link Select Cursor

Text Select Cursor

Working in Background Pointer

Busy Pointer

Unavailable Cursor

Precision Select Cursor

Error Icon
Warning Icon
Information Icon
Question Mark Icon
Balloon
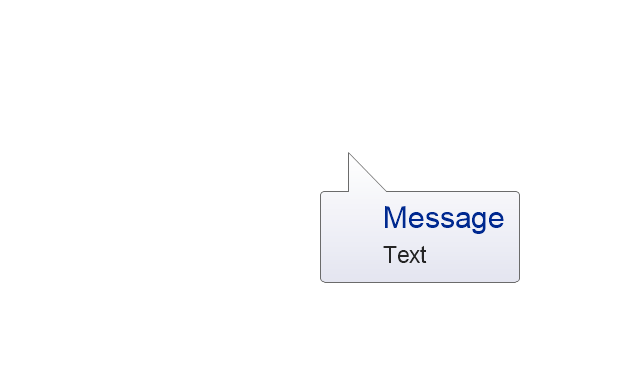
Tooltip/Infotip
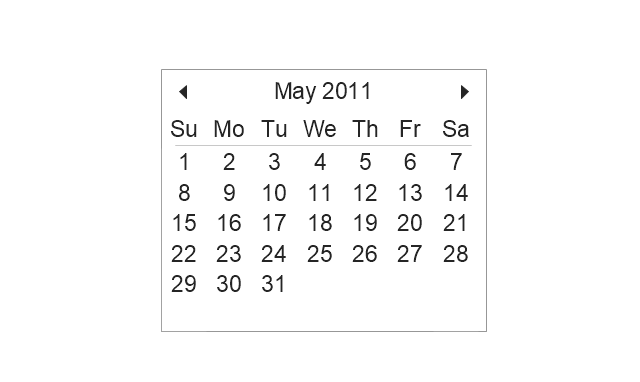
Calendar
How to Create a Line Chart

HelpDesk
How to Draw a Line Chart Quickly

"A football pitch (also known as a football field or soccer field) is the playing surface for the game of football made of turf. Its dimensions and markings are defined by Law 1 of the Laws of the Game, "The Field of Play".
All line markings on the pitch form part of the area which they define. For example, a ball on or above the touchline is still on the field of play; a ball on the line of the goal area is in the goal area; and a foul committed over the 16.5-metre (18-yard) line has occurred in the penalty area. Therefore a ball must completely cross the touchline to be out of play, and a ball must wholly cross the goal line (between the goal posts) before a goal is scored; if any part of the ball is still on or above the line, the ball is still in play.
The field descriptions that apply to adult matches are described below. Note that due to the original formulation of the Laws in England and the early supremacy of the four British football associations within IFAB, the standard dimensions of a football pitch were originally expressed in imperial units. The Laws now express dimensions with approximate metric equivalents (followed by traditional units in brackets), but use of the imperial units remains common in some countries, especially in the United Kingdom." [Association football pitch. Wikipedia]
The template "Vertical association football pitch" for the ConceptDraw PRO diagramming and vector drawing software is included in the Soccer solution from the Sport area of ConceptDraw Solution Park.
www.conceptdraw.com/ solution-park/ sport-soccer
Soccer field template

The vector stencils library "Education charts" contains 12 graphs and charts: area chart, column chart, divided bar diagram, histogram, horizontal bar graph, line graph, pie chart, ring chart, scatter plot.
Use it to create your educational infograms.
"A chart can take a large variety of forms, however there are common features that provide the chart with its ability to extract meaning from data.
Typically the data in a chart is represented graphically, since humans are generally able to infer meaning from pictures quicker than from text. Text is generally used only to annotate the data.
One of the more important uses of text in a graph is the title. A graph's title usually appears above the main graphic and provides a succinct description of what the data in the graph refers to.
Dimensions in the data are often displayed on axes. If a horizontal and a vertical axis are used, they are usually referred to as the x-axis and y-axis respectively. Each axis will have a scale, denoted by periodic graduations and usually accompanied by numerical or categorical indications. Each axis will typically also have a label displayed outside or beside it, briefly describing the dimension represented. If the scale is numerical, the label will often be suffixed with the unit of that scale in parentheses. ...
The data of a chart can appear in all manner of formats, and may include individual textual labels describing the datum associated with the indicated position in the chart. The data may appear as dots or shapes, connected or unconnected, and in any combination of colors and patterns. Inferences or points of interest can be overlaid directly on the graph to further aid information extraction.
When the data appearing in a chart contains multiple variables, the chart may include a legend (also known as a key). A legend contains a list of the variables appearing in the chart and an example of their appearance. This information allows the data from each variable to be identified in the chart." [Chart. Wikipedia]
The shapes example "Design elements - Education charts" was created using the ConceptDraw PRO diagramming and vector drawing software extended with the Education Infographics solition from the area "Business Infographics" in ConceptDraw Solution Park.
Graphs and charts

Basic Flowchart Symbols and Meaning


The vector stencils library "Wireframe" contains 18 wireframe design elements.
Use it for designing wireframe graphic user interface (GUI) of computer software in the ConceptDraw PRO diagramming and vector drawing software extended with the Graphic User Interface solution from the Software Development area of ConceptDraw Solution Park.
Use it for designing wireframe graphic user interface (GUI) of computer software in the ConceptDraw PRO diagramming and vector drawing software extended with the Graphic User Interface solution from the Software Development area of ConceptDraw Solution Park.
Dialog form
Dialog form (browser window)
-wireframe---vector-stencils-library.png--diagram-flowchart-example.png)
Area box

Text input box

Listbox

ComboBox
Scrollbar
Button
Radio button

Checkbox

Radio buttons group
Checkbox group
Menu bar tab
Image
Multimedia
Wireframe note
Separator, horizontal

Separator, vertical

The vector stencils library "MS Windows Vista user interface" contains 76 MS Windows Vista design elements.
Use it for designing Microsoft ribbon graphic user interface (GUI) of software for computers with MS Windows Vista OS in the ConceptDraw PRO diagramming and vector drawing software extended with the Graphic User Interface solution from the Software Development area of ConceptDraw Solution Park.
Use it for designing Microsoft ribbon graphic user interface (GUI) of software for computers with MS Windows Vista OS in the ConceptDraw PRO diagramming and vector drawing software extended with the Graphic User Interface solution from the Software Development area of ConceptDraw Solution Park.
Window
Dialog Window
Empty Window
Field
Horizontal Scrollbar
Vertical Scrollbar
Window Buttons
Window Buttons
Window Button 1
Window Button 2
Window Button 3
Window Button 4
Navigation
Menu Bar
Gradient Menu Bar
Drop-down Menu
Button
Toolbar Pannel
Tool Button
Primary Toolbar
Toolbar 1
Toolbar 2
Customizable Tollbar
Tab View
List View
Text Field
Vertical Separator
Horizontal Separator
Group Box
Text Label
Link
Line Edit
Search
Search with Button
Spin Box
Combo-box
Editable Combo-box
Editable List Box
List Box
Single-selection List
Multiple-selection List
Check Box
Radio Button
Check box group
Radio Buttons Group
Progress Bar
Modal Progress Bar
Vertical Slider with Ticks
Horizontal Slider with Ticks
Dial
Catalogue Tree
Tree View 1
Tree View 2
Vertical Spacer
Horizontal Spacer
Chevron 1
Arrow 1
Arrow 2
Plus/Minus Control
Rotating Triangle
Chevron 3
Chevron 2
Normal Select Cursor
Link Select Cursor
Text Select Cursor
Working in Background Pointer
Busy Pointer
Unavailable Cursor
Precision Select Cursor
Error Icon
Warning Icon
Information Icon
Question Mark Icon
Balloon
Tooltip/Infotip
Calendar
Bar Chart Software

Swim Lane Diagrams

How to Create a Column Chart

The vector stencils library "Ribbon interface" contains 41 ribbon shapes.
Use it for designing Microsoft ribbon graphic user interface (GUI) of software for Windows computers in the ConceptDraw PRO diagramming and vector drawing software extended with the Graphic User Interface solution from the Software Development area of ConceptDraw Solution Park.
Use it for designing Microsoft ribbon graphic user interface (GUI) of software for Windows computers in the ConceptDraw PRO diagramming and vector drawing software extended with the Graphic User Interface solution from the Software Development area of ConceptDraw Solution Park.
Main Window with Menu
Main Window
Menu
Special Menu
Field

Tools Group
Tools Group Minimized
Tool Button

Tool Button
Toolbar
Label
Text Label

Edit Box
Combobox
Combobox with List
Drop-down Menu
Spin Box
Check Box

Radio Button

Styles Control 1

Styles Control 2

Rounded Tab

Floating Dialogue
Status Bar

Small Toolbar (for Status Bar)
-ribbon-interface---vector-stencils-library.png--diagram-flowchart-example.png)
Zoom Slider

Horizontal Scroll
Vertical Scroll
Drop-down List

Arrow
Close

Drop-down Menu Base

Drop-down Menu Left Part

Menu/List Item (Text)
-ribbon-interface---vector-stencils-library.png--diagram-flowchart-example.png)
Menu/List Item (Image)
-ribbon-interface---vector-stencils-library.png--diagram-flowchart-example.png)
Menu/List Item (Image with Text)
-ribbon-interface---vector-stencils-library.png--diagram-flowchart-example.png)
Meny/List Header

Drop-down Menu Separator

Vertical Separator

Chek/Option for Drop-down Menu
Image

HelpDesk
How to Diagram Sentences in ConceptDraw PRO

Cross-Functional Flowchart


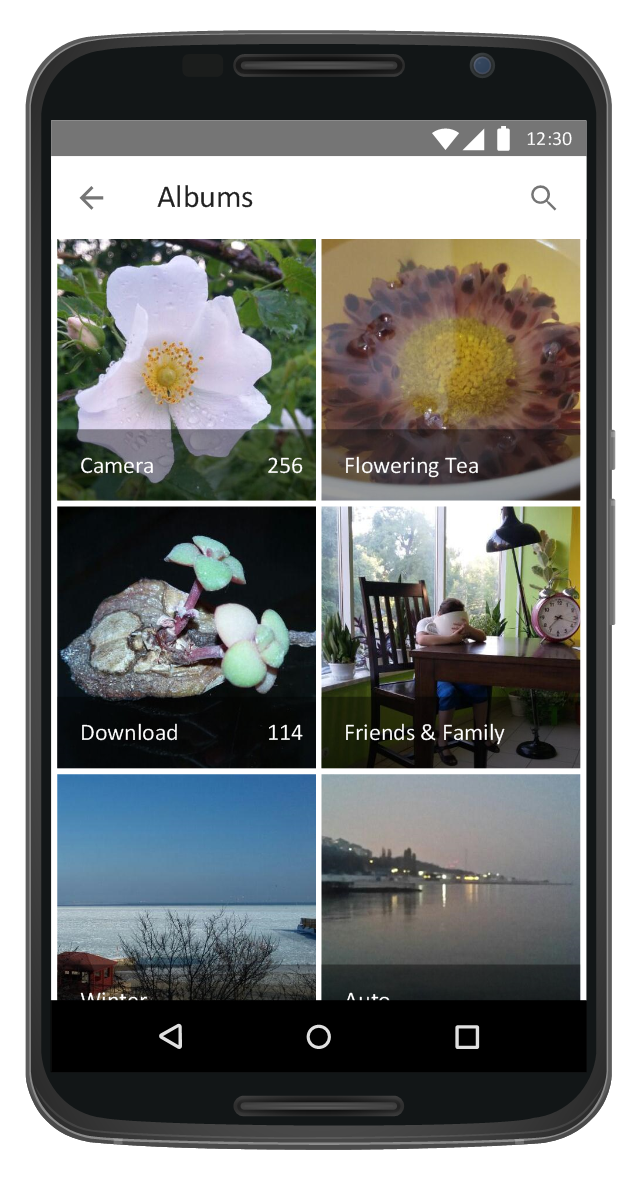
This Android 7 user interface example illustrates usage of Android Material Design single-line grid list.
"Grid lists are an alternative to standard list views.
A grid list consists of a repeated pattern of cells arrayed in a vertical and horizontal layout.
Grid lists are best used on similar data types. They help improve the visual comprehension of the content they contain. ...
A grid list is best suited to presenting homogenous data, typically images, and is optimized for visual comprehension and differentiating between similar data types. ...
A grid list consists of a repeated pattern of cells arrayed vertically and horizontally within the grid list.
Tiles hold content and can span one or more cells vertically or horizontally." [material.io/ guidelines/ components/ grid-lists.html]
The Android 7 UI design example "Single-line grid list" was created using the ConceptDraw PRO diagramming and vector drawing software extended with the "Android user interface" solution from the "Software Development" area of ConceptDraw Solution Park.
Single-line grid list
- Vertical Separator Lines Png
- Separator Line Vertical Png
- Vertical Text In Concept Draw
- Vertical Line Separator Vector Png
- Vertical Line Separator Images
- Line Bar Separator Image
- Vertical Separator Line Icon
- Vertical Divider Line Png
- Menu Separator Vertical Line Image
- Vertical Separator Icon Png
- Vertical Line Seperator
- Vertical Line Icon
- Separator Png Vertical
- Vertical Separator Icon Image
- Line Black Vertical Png
- Vertical Straight Line Png
- Line Separator Graphics
- Vertical Line For Website
- Scrolling Bar Vertical Png
- Menu Separator Bar