Venn Diagram Examples for Problem Solving. Venn Diagram as a Truth Table

Venn Diagrams

HelpDesk
How to Edit Grouped Objects on Mac

The vector stencils library "Venn diagrams" contains 12 templates of Venn and Euler diagrams.
Use these shapes to draw your Venn and Euler diagrams in the ConceptDraw PRO diagramming and vector drawing software extended with the Venn Diagrams solution from the area "What is a Diagram" of ConceptDraw Solution Park.
Use these shapes to draw your Venn and Euler diagrams in the ConceptDraw PRO diagramming and vector drawing software extended with the Venn Diagrams solution from the area "What is a Diagram" of ConceptDraw Solution Park.
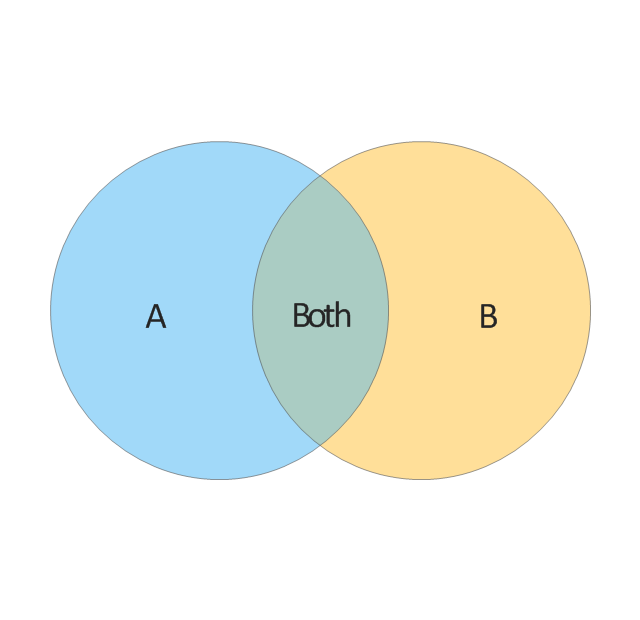
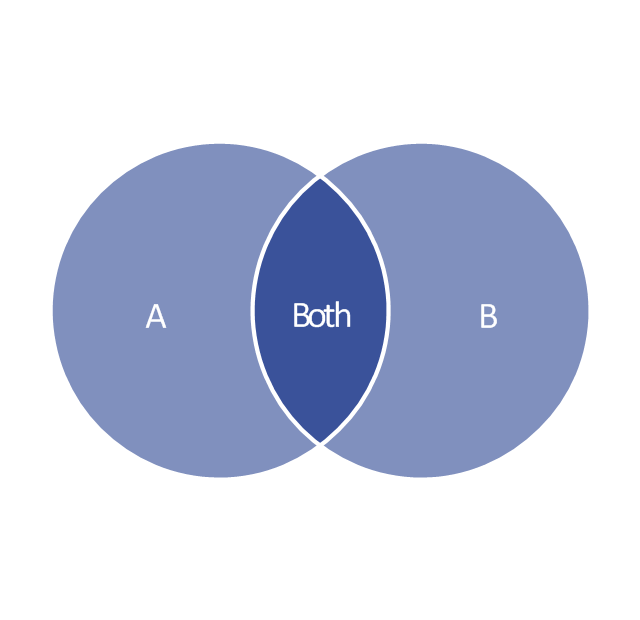
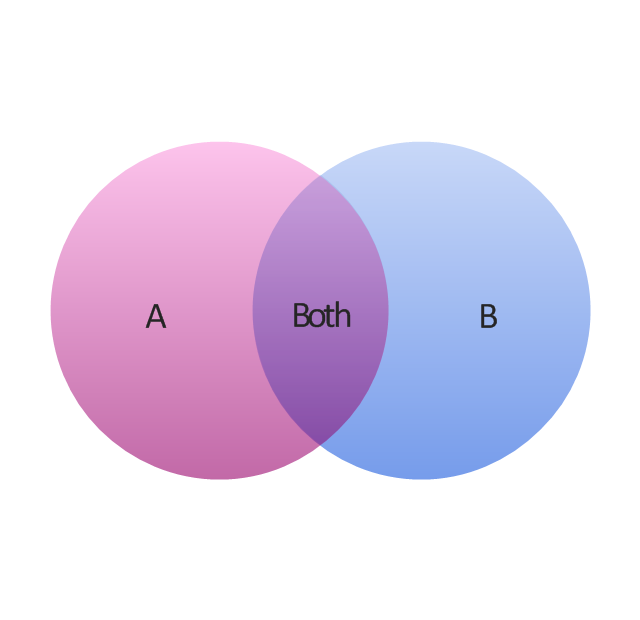
2-set Venn diagram
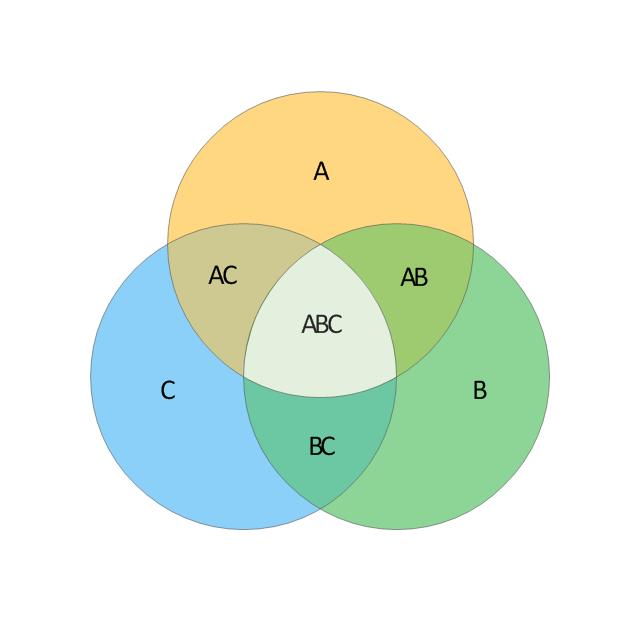
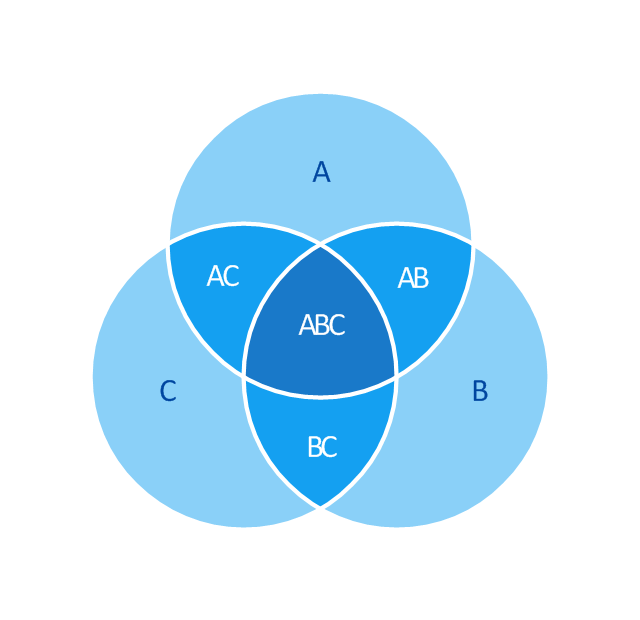
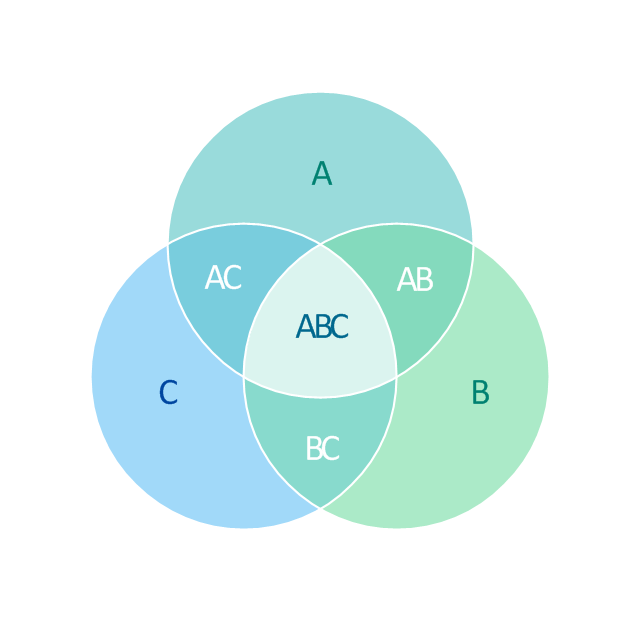
3-set Venn diagram
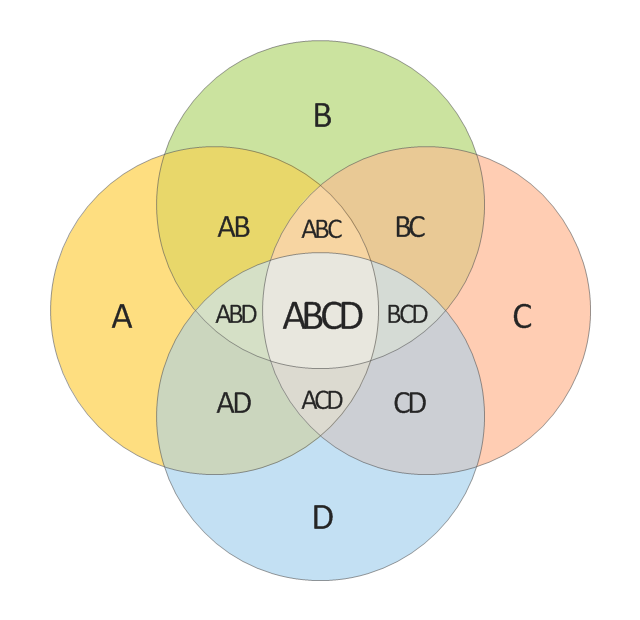
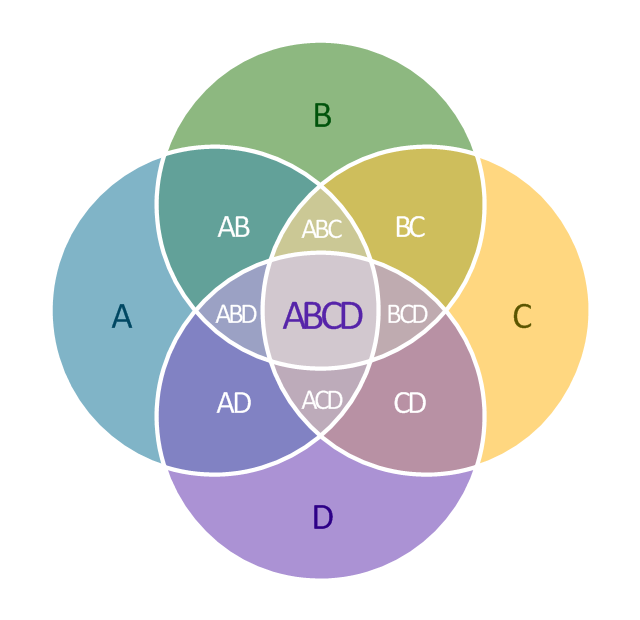
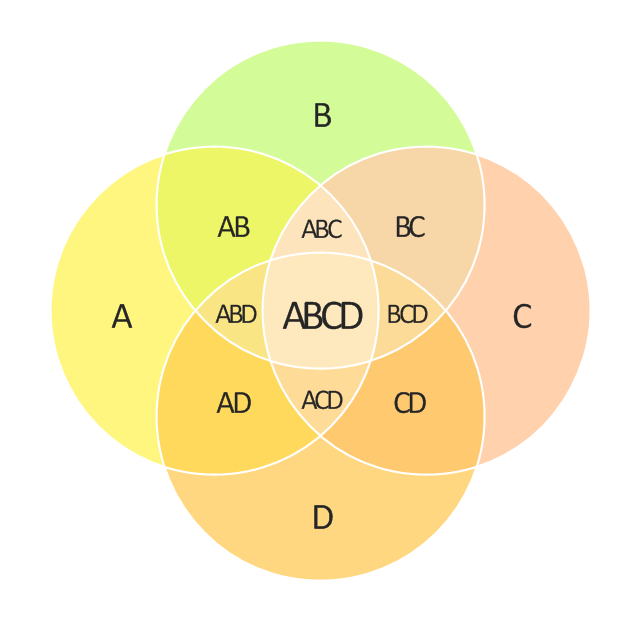
4-set Venn diagram
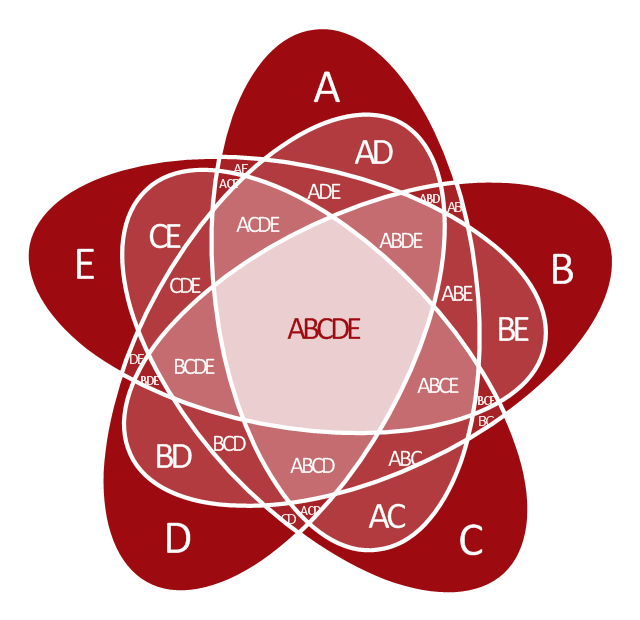
5-set Venn diagram

2-set Venn diagram
3-set Venn diagram
4-set Venn diagram
5-set Venn diagram
2-set Venn diagram
3-set Venn diagram
4-set Venn diagram
5-set Venn diagram

Basic Flowchart Symbols and Meaning


Venn Diagram Examples for Problem Solving

 Basic Diagramming
This solution extends ConceptDraw PRO software with the specific tools you need to easily draw flowcharts, block diagrams, histograms, pie charts, divided bar diagrams, line graphs, circular arrows diagrams, Venn diagrams, bubble diagrams and concept maps
The vector stencils library "Circular diagrams" contains 42 templates of circular diagrams: circular arrow diagram, circular motion diagram, arrow ring chart, doughnut chart (donut chart), circle pie chart, diamond pie chart, circle diagram, pie chart, ring chart, loop diagram, block loop diagram, arrow loop circle, crystal diagram, triangular diagram, diamond diagram, pentagon diagram, hexagon diagram, heptagon diagram, cycle diagram (cycle chart), stacked Venn diagram (onion diagram), arrow circle diagram.
Use these shapes to illustrate your marketing and sales documents, presentations, webpages and infographics in the ConceptDraw PRO diagramming and vector drawing software extended with the Target and Circular Diagrams solution from the Marketing area of ConceptDraw Solution Park.
www.conceptdraw.com/ solution-park/ marketing-target-and-circular-diagrams
Circular arrow diagram 1
Circular arrow diagram 2
Arrow ring chart
Doughnut chart

Diamond pie chart

Pie chart

Circle diagram

Circle pie chart 2

Circle pie chart 1

Ring chart 1 - 3 elements

Ring chart 1 - 4 elements

Ring chart 1 - 5 elements

Ring chart 1 - 6 elements

Ring chart 1 - 7 elements

Ring chart 2 - 3 elements

Ring chart 2 - 4 elements

Ring chart 2 - 5 elements

Ring chart 2 - 6 elements

Ring chart 2 - 7 elements

Crystal diagram - 3 elements

Crystal diagram - 4 elements

Crystal diagram - 5 elements

Crystal diagram - 6 elements

Crystal diagram - 7 elements

Stacked Venn diagram - 4

Stacked Venn diagram - 5

Stacked Venn diagram - 6

Stacked Venn diagram - 7

Basic loop diagram

Block loop diagram

Arrow loop circle
Arrow loop - 3 circles
Arrow loop - 4 circles
Arrow loop - 5 circles
Arrow loop - 6 circles
Arrow loop - 7 circles
Arrow circle diagram - 3
Arrow circle diagram - 4
Stacked Venn diagram - 3

Arrow circle diagram - 5
Arrow circle diagram - 6
Arrow circle diagram - 7
 Event-driven Process Chain Diagrams
Event-driven Process Chain (EPC) Diagram is a type of flowchart widely used for modeling in business engineering and reengineering, business process improvement, and analysis. EPC method was developed within the Architecture of Integrated Information Systems (ARIS) framework.
Mathematical Diagrams

HelpDesk
How to Draw a Pyramid Diagram in ConceptDraw PRO

Scientific Symbols Chart

Mathematics Solution from the Science and Education area of ConceptDraw Solution Park includes a few shape libraries of plane, solid geometric figures, trigonometrical functions and greek letters to help you create different professional looking mathematic illustrations for science and education.
New Connectors Technology

- Venn Diagrams | Cisco Routers. Cisco icons, shapes , stencils and ...
- Basic Diagramming | Mathematical Diagrams | How to Draw ...
- Mathematical Diagrams | Mathematics Symbols | How to Draw ...
- The Diagram Of Plane Shapes
- Venn diagrams - Vector stencils library | 2-Set Venn diagram ...
- Diagrams Of Plane Shapes
- 5-Set Venn diagram - Template | Venn diagrams - Vector stencils ...
- What Are The Shapes Of Flow Chart
- 5-Set Venn diagram - Template | Venn Diagrams | Venn diagrams ...
- Venn Diagram Examples for Problem Solving. Computer Science ...
- How to Draw Geometric Shapes in ConceptDraw PRO ...
- Circles Venn Diagram
- Basic Flowchart Symbols and Meaning | Venn Diagram Examples ...
- Flowchart design. Flowchart symbols, shapes , stencils and icons ...
- Venn Diagrams | Venn Diagram | How to Create a Venn Diagram in ...
- How to Draw Geometric Shapes in ConceptDraw PRO ...
- 2 Circle Venn Diagrams
- Flowchart design. Flowchart symbols, shapes , stencils and icons ...
- Process Diagram Flow Symbols
- Basic Flowchart Symbols and Meaning | Flowchart design ...