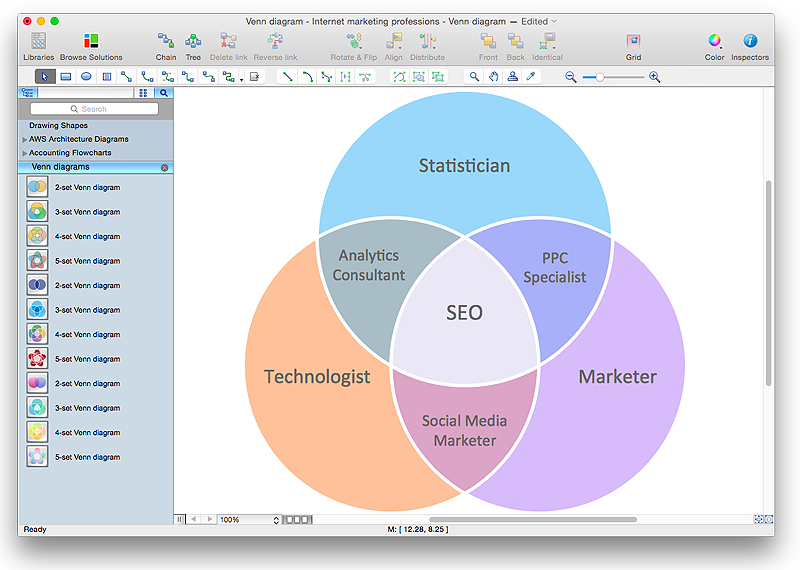
3 Circle Venn Diagram. Venn Diagram Example

Export from ConceptDraw DIAGRAM Document to a Graphic File


Cylinder Venn Diagram

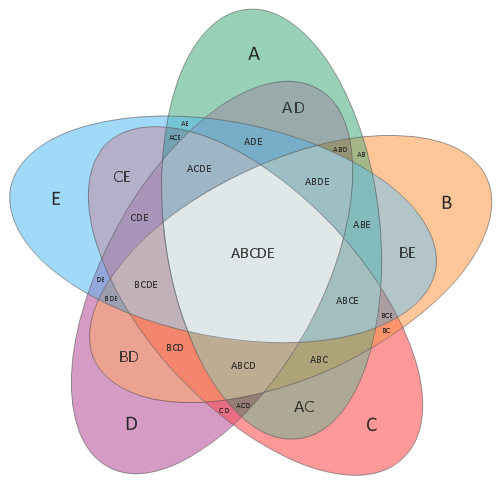
 Basic Venn Diagrams
This solution extends ConceptDraw DIAGRAM (or later) with samples, templates, and libraries of vector stencils for drawing Venn Diagrams.
Multi Layer Venn Diagram. Venn Diagram Example

HelpDesk
How to Create a Venn Diagram
Basic Circles Venn Diagram. Venn Diagram Example

Venn Diagram Template
Venn Diagram Examples for Problem Solving. Environmental Social Science. Human Sustainability Confluence

Venn Diagram

- 8 Circle Marketing Diagram Png
- Venn Diagrams | Marketing Diagrams | Sales Flowcharts ...
- 3 Circle Venn Diagram . Venn Diagram Example | Professions ...
- 3 Circle Venn. Venn Diagram Example | Flowchart design. Flowchart ...
- Community elements overlapping | Germany Map | Venn Diagram ...
- Cylinder Venn Diagram | Venn Diagram Maker | Venn Diagram ...
- Research cycle - Circle diagram | Circular diagrams - Vector stencils ...
- How to Draw an Organization Chart | Multi Layer Venn Diagram ...
- Knowledge - Venn diagram | Knowledge hierarchy triangle diagram ...
- Triangular Venn diagram - Template | Pyramid diagrams - Vector ...