This Venn diagram sample depicts the path to sustainable development.
"Sustainable development is an organizing principle for human life on a finite planet. It posits a desirable future state for human societies in which living conditions and resource-use meet human needs without undermining the sustainability of natural systems and the environment, so that future generations may also have their needs met.
Sustainable development ties together concern for the carrying capacity of natural systems with the social and economic challenges faced by humanity. As early as the 1970s, 'sustainability' was employed to describe an economy "in equilibrium with basic ecological support systems." Scientists in many fields have highlighted The Limits to Growth, and economists have presented alternatives, for example a 'steady state economy', to address concerns over the impacts of expanding human development on the planet." [Sustainable development. Wikipedia]
The Venn diagram example "Path to sustainable development" was created using the ConceptDraw PRO diagramming and vector drawing software extended with the Venn Diagrams solution from the area "What is a Diagram" of ConceptDraw Solution Park.
Venn diagram

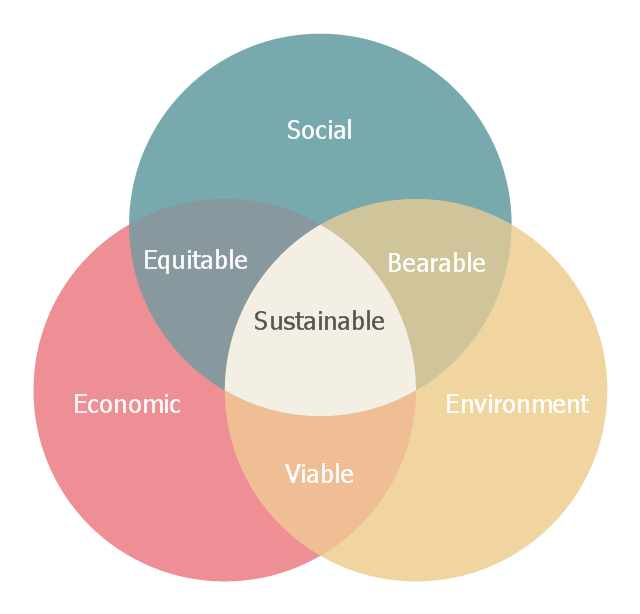
This Venn diagram sample shows the sustainable development at the confluence of three constituent parts: social, economic and environment. It was designed on the base of the Wikimedia Commons file: Sustainable development.svg.
[commons.wikimedia.org/ wiki/ File:Sustainable_ development.svg]
This file is licensed under the Creative Commons Attribution-Share Alike 3.0 Unported license. [creativecommons.org/ licenses/ by-sa/ 3.0/ deed.en]
"Sustainable development is an organizing principle for human life on a finite planet. It posits a desirable future state for human societies in which living conditions and resource-use meet human needs without undermining the sustainability of natural systems and the environment, so that future generations may also have their needs met.
Sustainable development ties together concern for the carrying capacity of natural systems with the social and economic challenges faced by humanity. " [Sustainable development. Wikipedia]
The Venn diagram example "Sustainable development" was created using the ConceptDraw PRO diagramming and vector drawing software extended with the Venn Diagrams solution from the area "What is a Diagram" of ConceptDraw Solution Park.
Venn diagram
Venn Diagram Examples for Problem Solving

Venn Diagram Examples for Problem Solving. Environmental Social Science. Human Sustainability Confluence

Simple Drawing Applications for Mac

Pyramid Diagram

 Business Diagrams
The Business Diagrams Solution extends ConceptDraw DIAGRAM with an extensive collection of professionally designed illustrative samples and a wide variety of vector stencils libraries, which are the real help for all business-related people, business analysts, business managers, business advisers, marketing experts, PR managers, knowledge workers, scientists, and other stakeholders allowing them to design the bright, neat, expressive and attractive Bubble Diagrams, Circle-Spoke Diagrams, Circular Arrows Diagrams, and Venn Diagrams with different quantity of sets in just minutes; and then successfully use them in documents, reports, statistical summaries, and presentations of any style.
 Human Anatomy
Human Anatomy solution extends ConceptDraw DIAGRAM functionality with best tools to design diagrams and illustrations for using in a sphere of medicine and health care, infographics on the human physiology and anatomy thematic, to represent the structure of male and female bodies from the front and back views, description in details any of physiological systems of the human organism, such as central and peripheral nervous systems, respiratory system, cardiovascular system, digestive system, endocrine system, reproductive system, urinary system, skeletal system, muscular system, integumentary system, lymphatic system, sensory system, visual system, immune system.
 Flowcharts
The Flowcharts solution for ConceptDraw DIAGRAM is a comprehensive set of examples and samples in several varied color themes for professionals that need to represent graphically a process. Solution value is added by the basic flow chart template and shapes' libraries of flowchart notation. ConceptDraw DIAGRAM flow chart creator lets one depict the processes of any complexity and length, as well as design the Flowchart either vertically or horizontally.
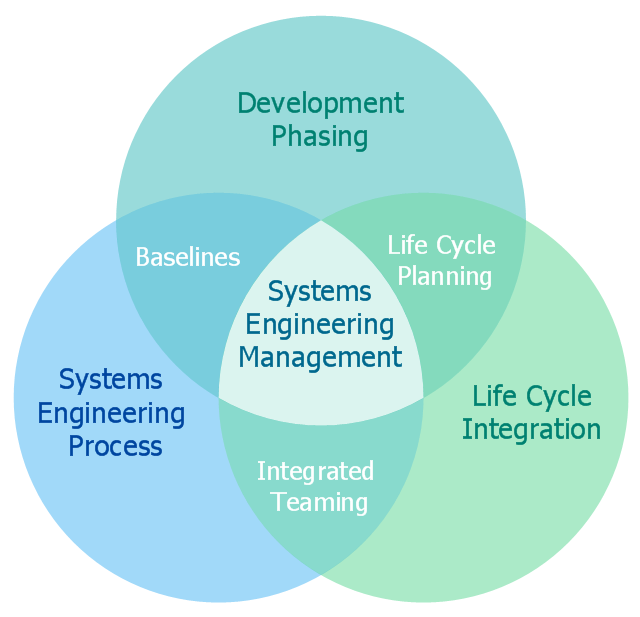
This Venn diagram sample shows the systems engineering activities. It was designed on the base of the Wikimedia Commons file: SE Activities.jpg. [commons.wikimedia.org/ wiki/ File:SE_ Activities.jpg]
"Systems engineering is an interdisciplinary field of engineering that focuses on how to design and manage complex engineering systems over their life cycles. At its core systems engineering utilizes systems thinking principles to organize this body knowledge. Issues such as requirements engineering, reliability, logistics, coordination of different teams, testing and evaluation, maintainability and many other disciplines necessary for successful system development, design, implementation, and ultimate decommission become more difficult when dealing with large or complex projects. Systems engineering deals with work-processes, optimization methods, and risk management tools in such projects. It overlaps technical and human-centered disciplines such as industrial engineering, manufacturing engineering, control engineering, software engineering, electrical engineering, cybernetics, organizational studies, and project management. Systems engineering ensures that all likely aspects of a project or system are considered, and integrated into a whole." [Systems engineering. Wikipedia]
The Venn diagram example "Systems engineering activities" was created using ConceptDraw DIAGRAM software extended with Business Diagrams solution from Management area of ConceptDraw Solution Park.
Venn diagram
- Principle Of Human Development In Venn Diagram
- Human Development Diagrams
- Principle On Human Development In Venn Diagram
- Principles Of Drwaing Venn Diagram
- Venn Diagram Of Growth And Development
- Venn Diagram Examples for Problem Solving. Environmental Social ...
- Sustainable development | Venn Diagram | Path to sustainable ...
- Venn Diagram In Community Development
- Energy resources diagram | Path to sustainable development ...
- Venn diagram - Path to sustainable development | Sustainable ...