Venn Diagram Examples for Problem Solving. Venn Diagram as a Truth Table

Venn Diagram Examples for Problem Solving. Computer Science. Chomsky Hierarchy

Venn Diagram Template for Word

Venn Diagram Examples for Problem Solving. Environmental Social Science. Human Sustainability Confluence

Cylinder Venn Diagram

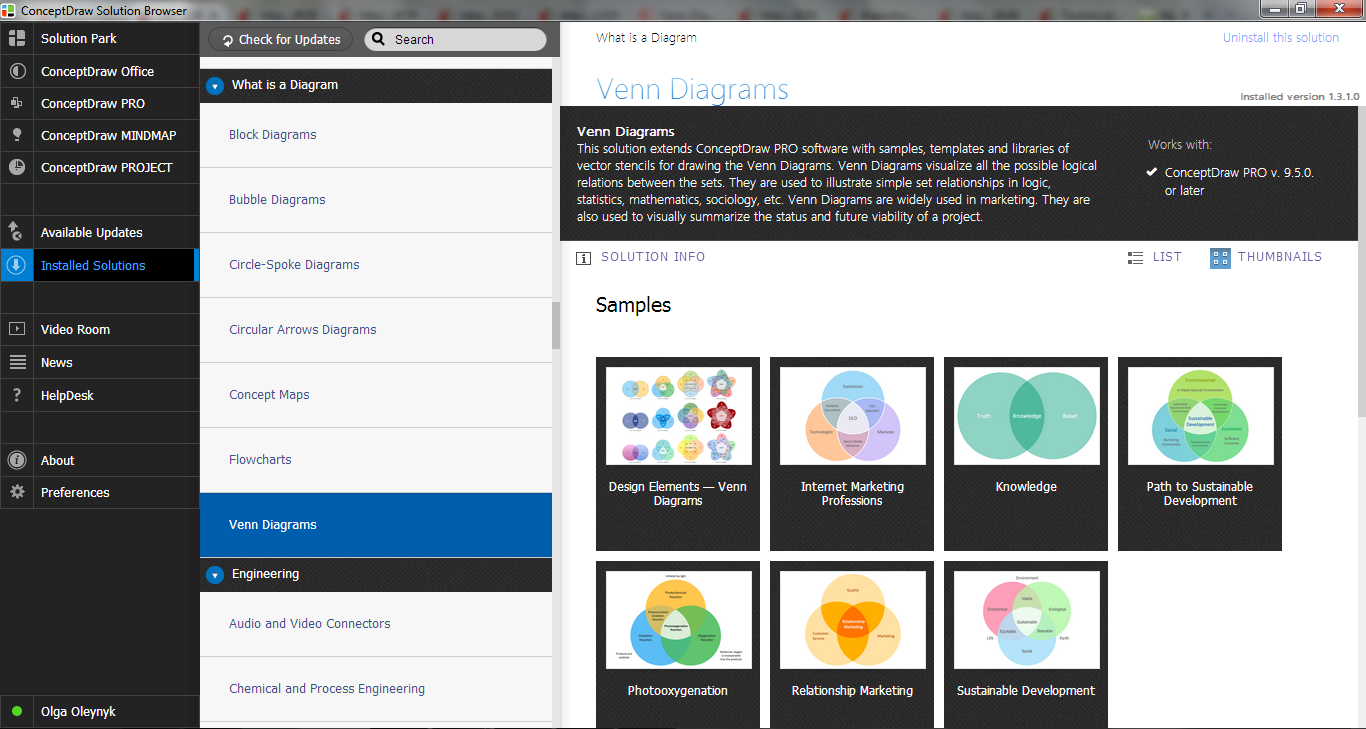
Venn Diagrams

Venn Diagram Examples for Problem Solving

Basic Circles Venn Diagram. Venn Diagram Example

2 Circle Venn Diagram. Venn Diagram Example

Venn Diagram Maker

3 Circle Venn. Venn Diagram Example

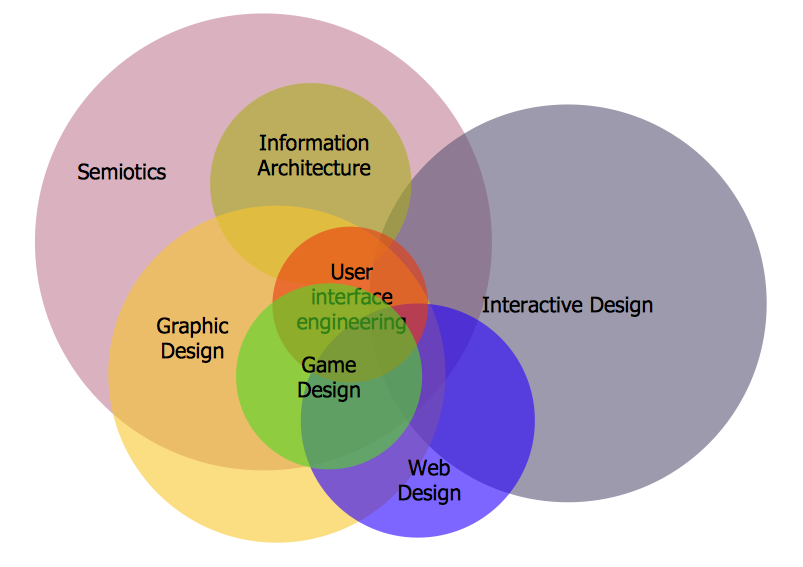
Multi Layer Venn Diagram. Venn Diagram Example

Interactive Venn Diagram
Venn Diagram Examples
Circuits and Logic Diagram Software

- Venn Diagram Examples for Problem Solving. Venn Diagram as a ...
- 3 Circle Venn Diagram . Venn Diagram Example | Circular diagrams ...
- Venn Diagram Examples for Problem Solving. Venn Diagram as a ...
- Interactive Venn Diagram | Venn Diagram Examples for Problem ...
- Venn Diagram Maker | Venn Diagram Examples for Problem Solving ...
- Circuits and Logic Diagram Software | Venn Diagram Examples for ...
- 3 Circle Venn Diagram Problems And Solutions
- Using Fishbone Diagrams for Problem Solving | Fishbone Diagram ...
- Venn Diagrams | Venn Diagram Examples for Problem Solving ...
- Venn Diagram
- Venn Diagrams
- Venn Diagrams | Venn Diagram Maker | Venn Diagram Examples ...
- Venn Diagram Examples for Problem Solving. Computer Science ...
- Venn Diagram Examples for Problem Solving. Environmental Social ...
- 3 Set Venn Diagram
- Venn Diagram Examples for Problem Solving. Environmental Social ...
- Basic Flowchart Symbols and Meaning | Venn Diagram Examples ...
- Venn Diagrams Examples 2 Circles
- Best Vector Drawing Application for Mac OS X | Venn Diagram ...
- Process Flowchart | Venn Diagram Examples for Problem Solving ...