Multi Layer Venn Diagram. Venn Diagram Example

Venn Diagram Examples for Problem Solving. Computer Science. Chomsky Hierarchy

Venn Diagram

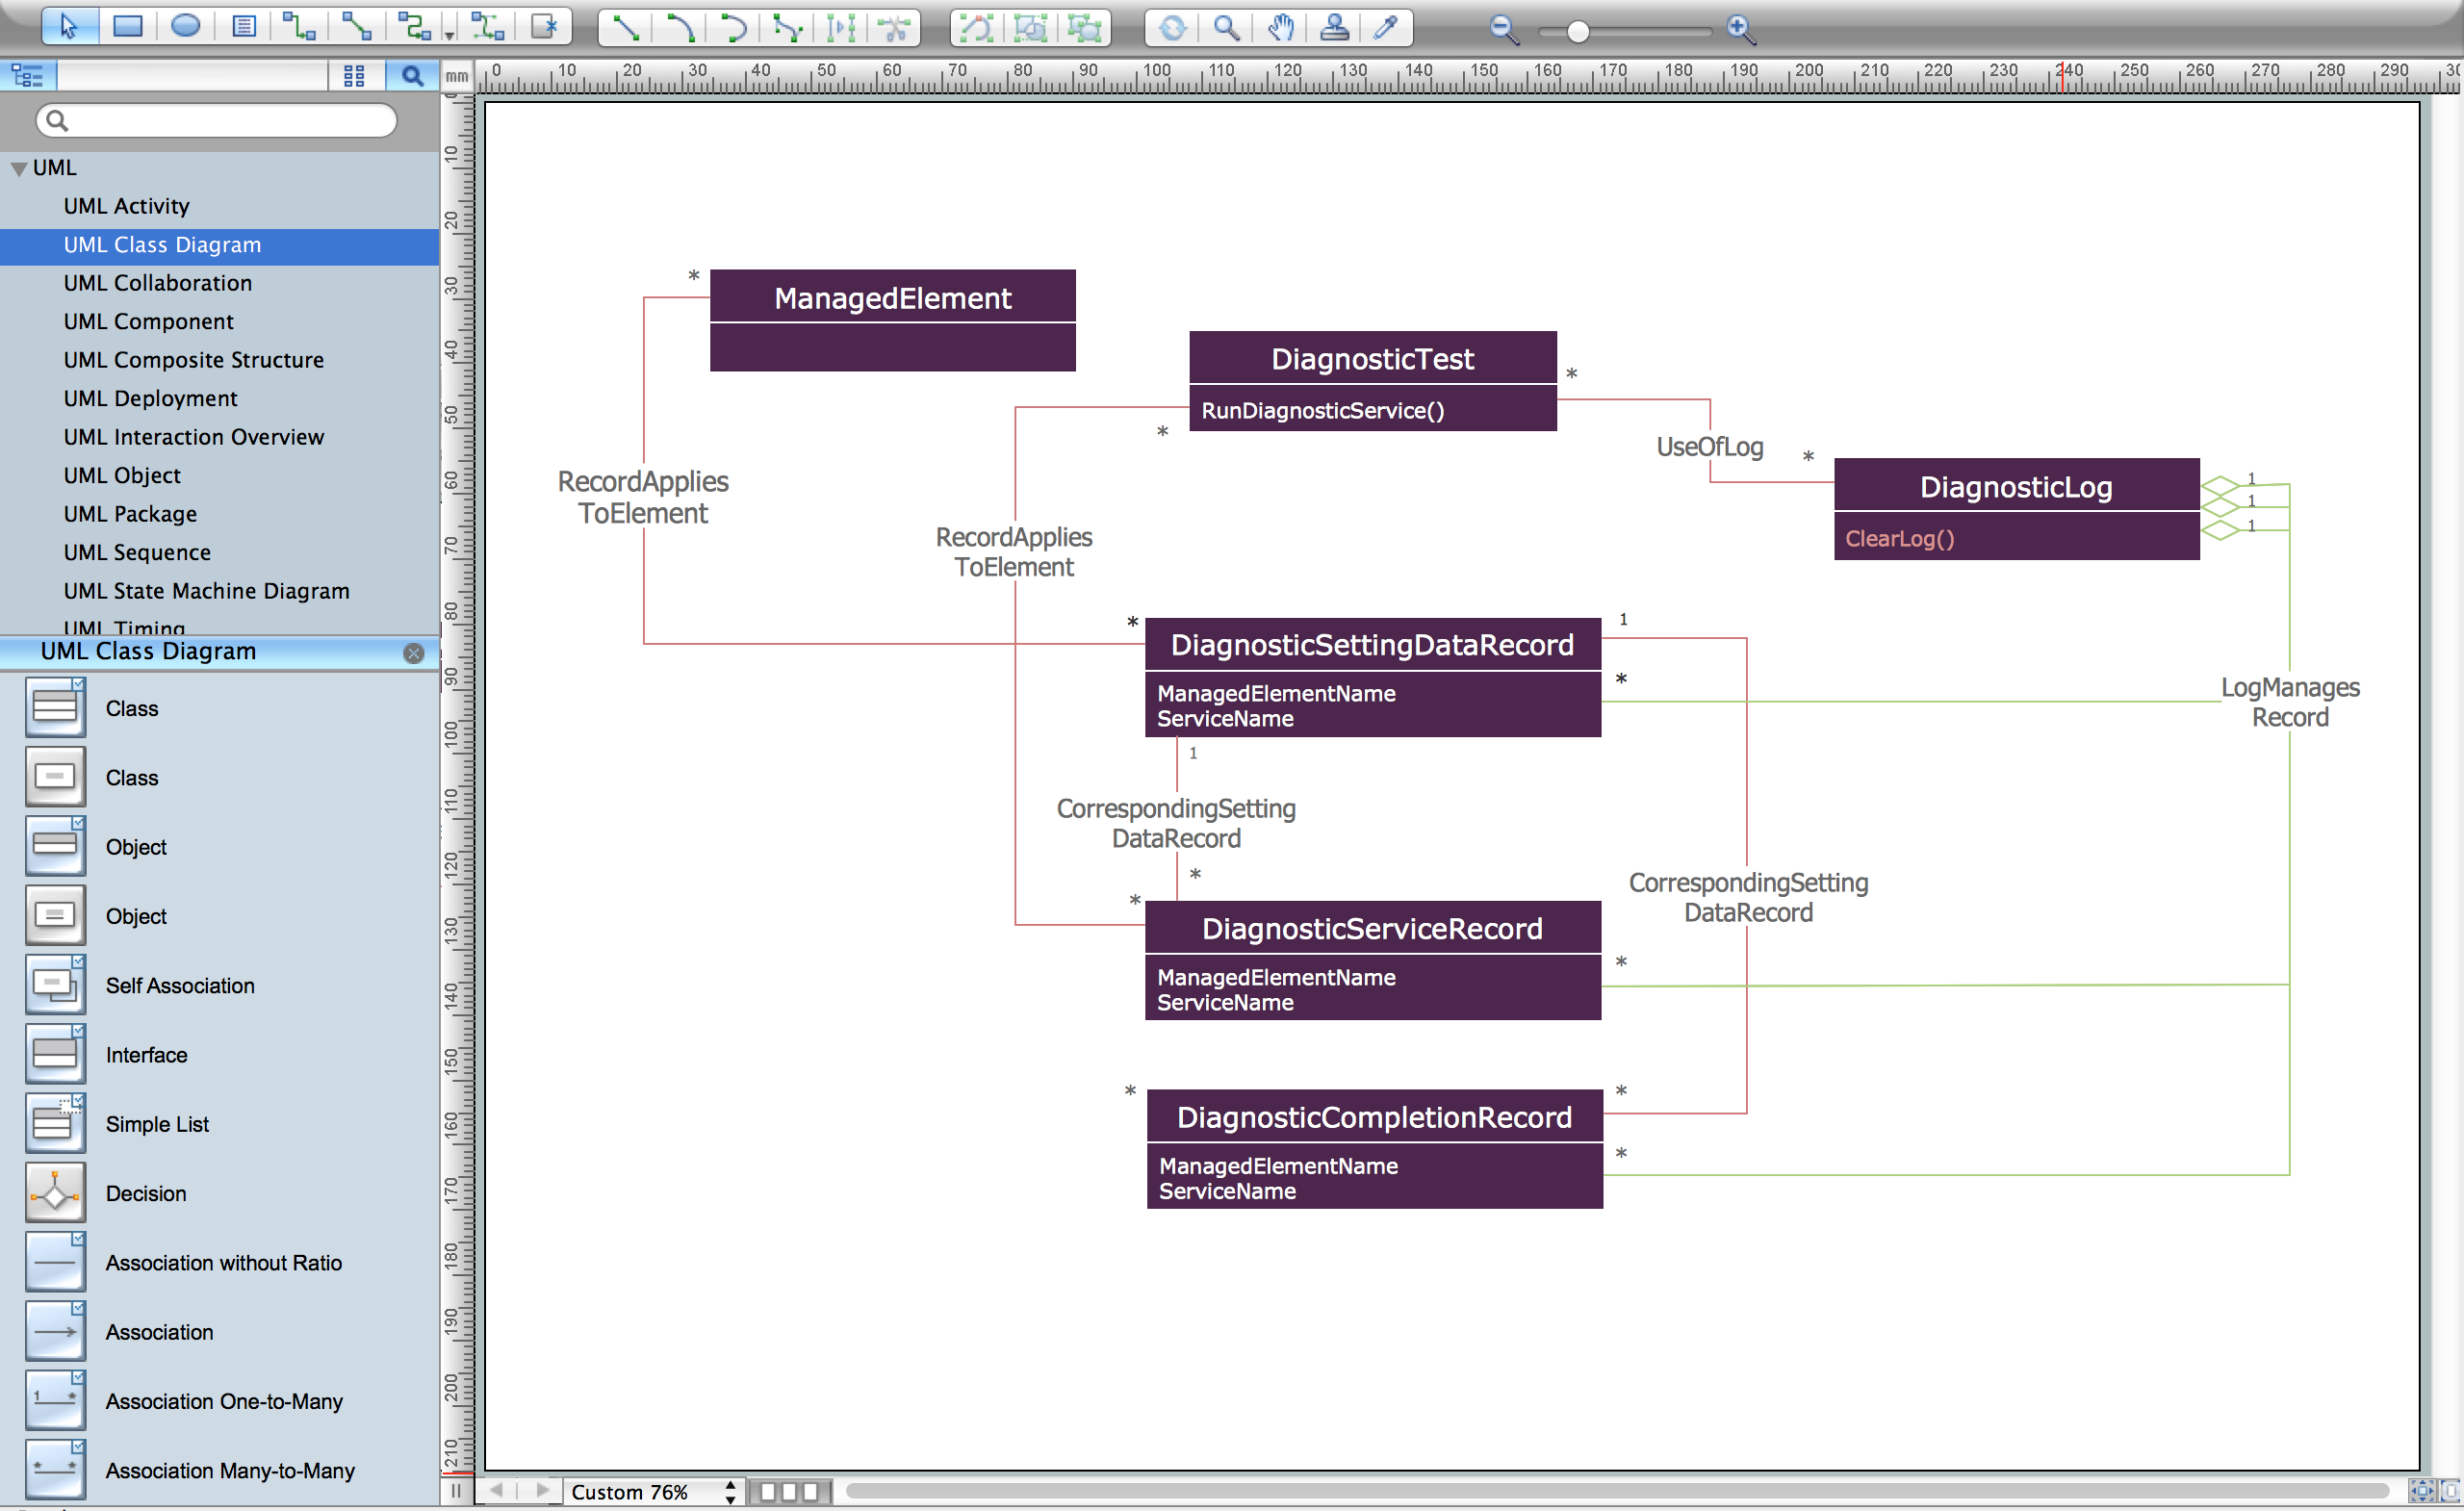
UML Diagram

UML Class Diagram Constructor
Venn Diagram Examples for Problem Solving

Venn Diagram Examples for Problem Solving. Environmental Social Science. Human Sustainability Confluence

 Basic Venn Diagrams
This solution extends ConceptDraw DIAGRAM (or later) with samples, templates, and libraries of vector stencils for drawing Venn Diagrams.
Data Flow Diagrams

 Venn Diagrams
Venn Diagrams are actively used to illustrate simple set relationships in set theory and probability theory, logic and statistics, mathematics and computer science, linguistics, sociology, and marketing. Venn Diagrams are also often used to visually summarize the status and future viability of a project.
- Venn Diagrams | Draw A Component Diagram For Library System
- Venn Diagram Examples for Problem Solving . Quantum Information ...
- Pyramid Diagram | UML Class Diagram Generalization Example ...
- How to Create a Venn Diagram in ConceptDraw PRO | Venn ...
- Rapid UML | Solution Of Venn Diagram From Boolean Algebra
- Venn Diagram Examples for Problem Solving. Computer Science ...
- SYSML | Rapid UML | Boolean Venn Diagram Generator
- Venn Diagrams | Venn Diagram Examples for Problem Solving ...
- UML Diagram
- UML component diagram - Template | Venn Diagrams | Component ...