Venn Diagram Template
Venn Diagram Maker

Cylinder Venn Diagram

 Venn Diagrams
Venn Diagrams are actively used to illustrate simple set relationships in set theory and probability theory, logic and statistics, mathematics and computer science, linguistics, sociology, and marketing. Venn Diagrams are also often used to visually summarize the status and future viability of a project.
Venn Diagram Examples for Problem Solving. Environmental Social Science. Human Sustainability Confluence

Venn Diagram Examples for Problem Solving. Venn Diagram as a Truth Table

Circles Venn Diagram

Multi Layer Venn Diagram. Venn Diagram Example

Venn Diagram

3 Circle Venn. Venn Diagram Example

Venn Diagrams

Flowchart Software

Venn Diagram Examples for Problem Solving. Computer Science. Chomsky Hierarchy

Interactive Venn Diagram
Basic Diagramming


- Free Image Venn Diagram
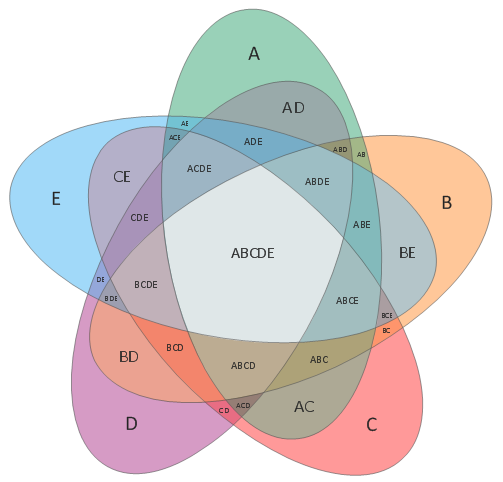
- 5-Set Venn diagram - Template | Context Diagram Template ...
- Venn Diagram Examples for Problem Solving. Venn Diagram as a ...
- Venn Diagrams | Venn Diagram | How to Create a Venn Diagram in ...
- Venn Diagram Maker Free
- Download Free Flowchart Maker
- Create Graphs and Charts | Organization Chart Templates | Simple ...
- Venn Diagram | Venn Diagram Examples | Venn Diagram Template ...
- Bio Diagram Free Download
- Free Diagram Template
- Sample Venn Diagram Template
- Popular Venn Diagram Templates
- Universal Set With Venn Diagram Download
- Venn Diagrams | Venn Diagram Examples | Venn Diagram ...
- Triangular Venn diagram - Template | Pyramid Diagram and ...
- Flow Chart Template Powerpoint Free Download
- Basic Flowchart Symbols and Meaning | Venn Diagram Examples ...
- Venn diagrams - Vector stencils library | 2-Set Venn diagram ...
- Circle Diagrams Templates
- Basic Flowchart Symbols and Meaning | Flowcharts | Circles Venn ...