Jacobson Use Cases Diagram

HelpDesk
How to Create a Bank ATM Use Case Diagram

 ATM UML Diagrams
The ATM UML Diagrams solution lets you create ATM solutions and UML examples. Use ConceptDraw DIAGRAM as a UML diagram creator to visualize a banking system.
Create Sophisticated Professional Diagrams - Simply

 SYSML
SYSML
The SysML solution helps to present diagrams using Systems Modeling Language; a perfect tool for system engineering.
HelpDesk
How to Create a UML Diagram Quickly
 Rapid UML
Rapid UML solution extends ConceptDraw DIAGRAM software with templates, samples and libraries of vector stencils for quick drawing the UML diagrams using Rapid Draw technology.
 PM Personal Time Management
PM Personal Time Management solution extends the ConceptDraw Solution Park and all ConceptDraw Office suite products providing every project participant with tools and features allowing tracking timeframe, workspace and role in a project with the aid of Microreports, calendars, and project To-Do lists. PM Personal Time Management solution makes the collaborative work easier and improves personal performance, now each project participant stays informed about the task lists, calendars and future tasks for itself and its colleagues. Be effective in project management and personal time management, generate easily your personal To-Do lists, personal calendars, personal assignment lists, project checklists, and communicate with your colleagues using e-mail and sending project Microreports via e-mail with one click.
Bar Diagrams for Problem Solving. Create event management bar charts with Bar Graphs Solution

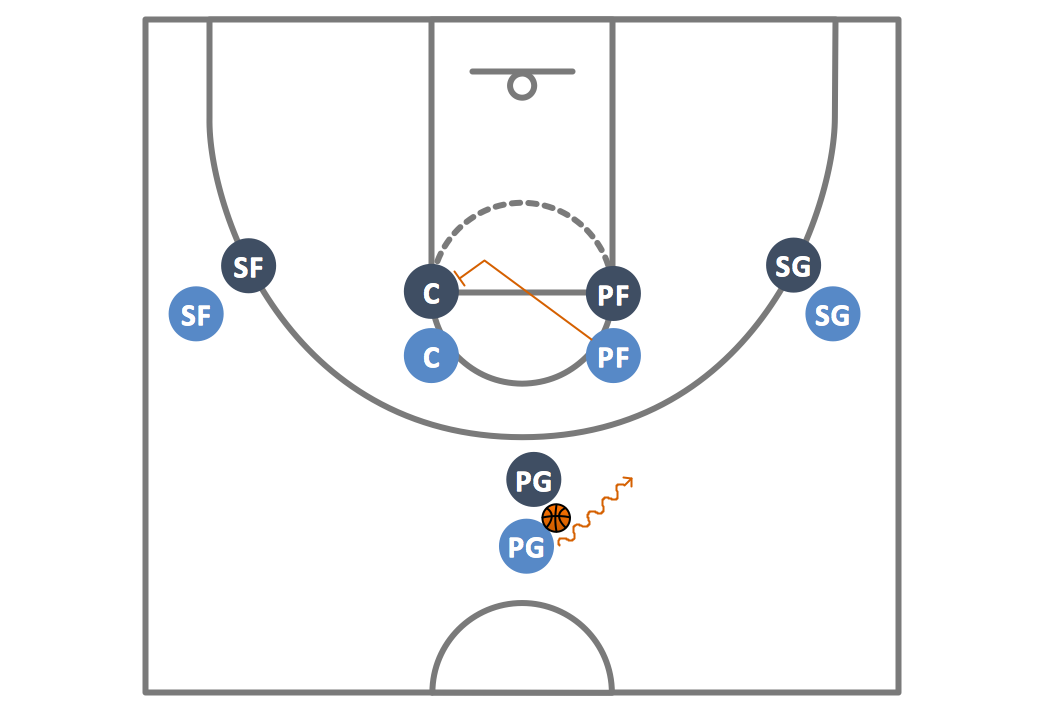
Basketball Plays Diagrams
Developing Entity Relationship Diagrams

 Interactive Voice Response Diagrams
Interactive Voice Response Diagrams solution extends ConceptDraw DIAGRAM software with samples, templates and libraries of ready-to-use vector stencils that help create Interactive Voice Response (IVR) diagrams illustrating in details a work of interactive voice response system, the IVR system’s logical and physical structure, Voice-over-Internet Protocol (VoIP) diagrams, and Action VoIP diagrams with representing voice actions on them, to visualize how the computers interact with callers through voice recognition and dual-tone multi-frequency signaling (DTMF) keypad inputs.
Examples of Flowcharts, Org Charts and More


 Fishbone Diagrams
The Fishbone Diagrams solution extends ConceptDraw DIAGRAM software with the ability to easily draw the Fishbone Diagrams (Ishikawa Diagrams) to clearly see the cause and effect analysis and also problem solving. The vector graphic diagrams produced using this solution can be used in whitepapers, presentations, datasheets, posters, and published technical material.
- Use Case Diagram For Sports Management System
- SYSML | UML Diagram | Rapid UML | Sequence Diagram For Sports ...
- Football Management System Uml
- Use Case Diagram For Sports Management Project
- Uml Diagrams For Sports Management Systems
- Class Diagram For Sports Management System
- Use Case Diagram For Sports Shop Management
- Use Case Diagram Of Online Sports Event Management System
- Use Case Diagram For Sports Event Management System
- Usecase Diagram For Sports Event Management System
- Use Case Diagram For Sport App
- Sports Event Management Usecase Diagram
- Use Case Diagram Of Court Management System
- UML Class Diagram Generalization Example UML Diagrams ...
- Usecase Diagram For Football Management System
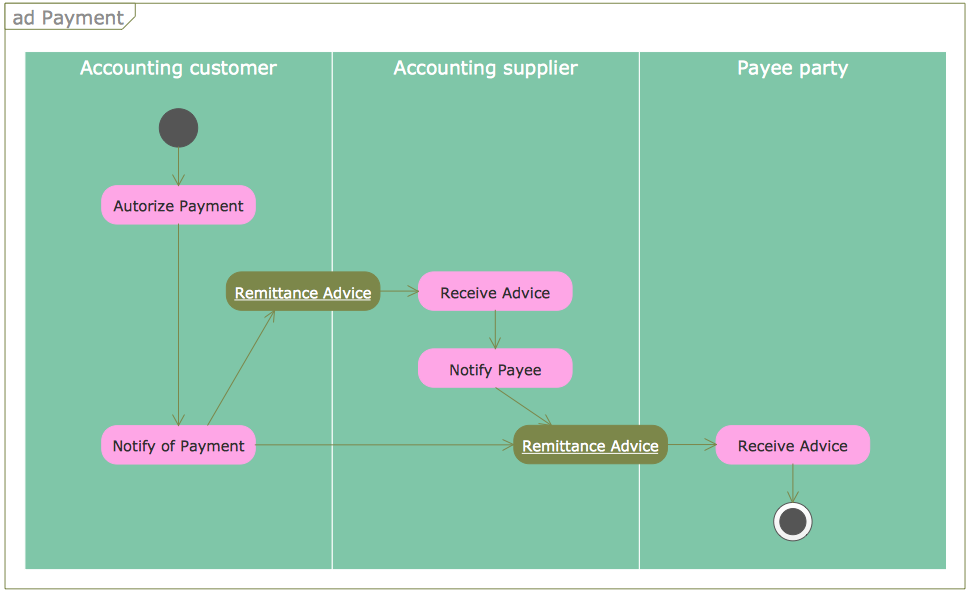
- SYSML | Rapid UML | Process Flowchart | Activity Diagram For ...
- State Diagram Of Sports Management
- Sports Event Management Use Case Diagram
- Use Case Diagram For Court Management System