UML Collaboration Diagram (UML2.0)


UML Tool & UML Diagram Examples

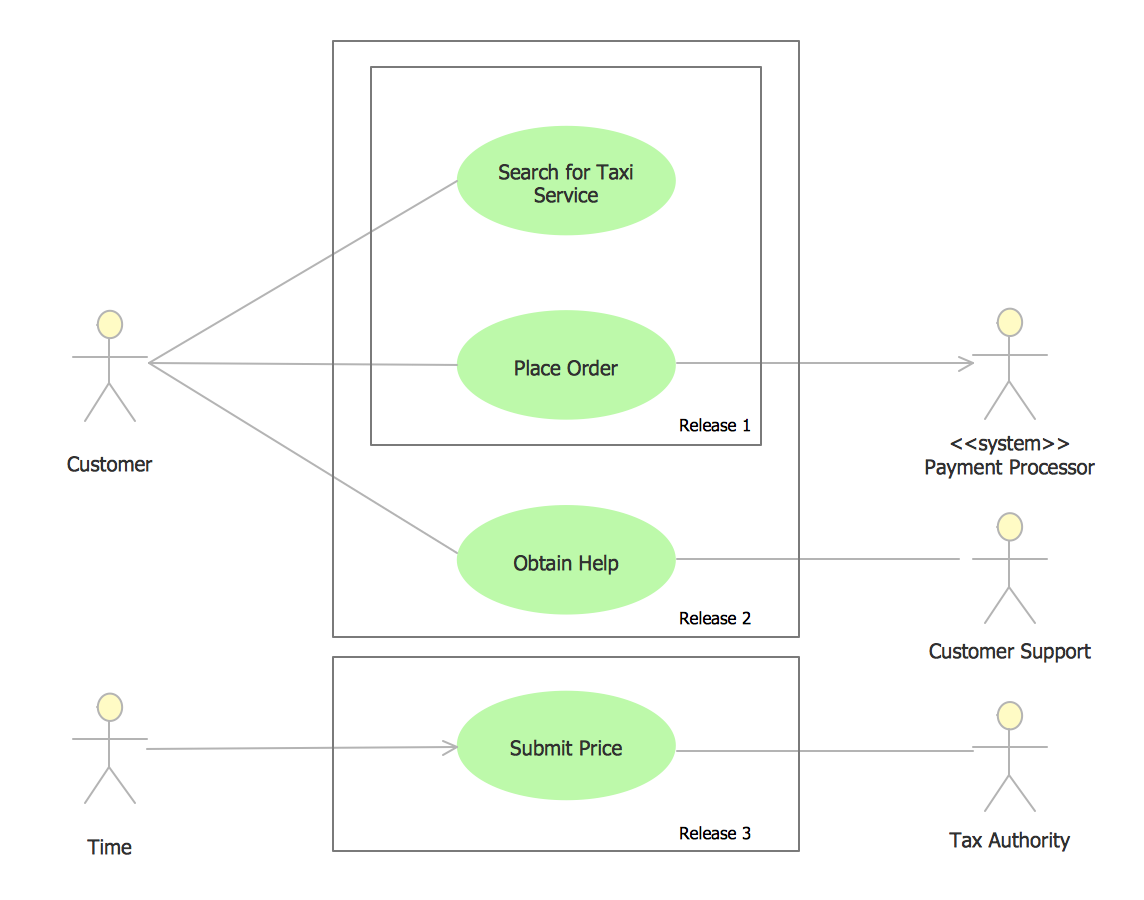
UML Use Case Diagram Example - Taxi Service
UML Component Diagram Example - Online Shopping

ConceptDraw DIAGRAM ER Diagram Tool

Example of DFD for Online Store (Data Flow Diagram)


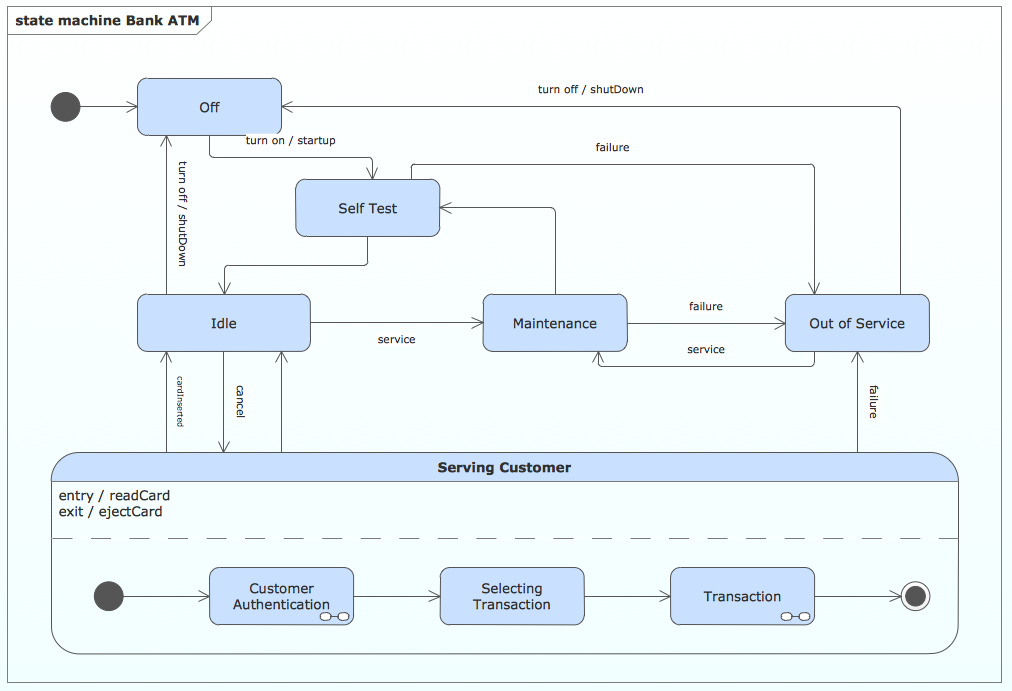
State Machine Diagram
This SWOT matrix diagram example was created on the base of article "An Easy Way To Jumpstart Your Strategic Plan: SWOT" by Leslie Wolf from the website of the California Digital Library, the University of California. "Strategic planning doesn’t have to be a daunting and lengthy process. The goal is really a simple one: to help you understand your world and build a road map to guide your efforts. ...
This analysis tool can help you focus your attention on the specific success factors that are right for your team.
The tool is called a SWOT analysis. SWOT stands for Strengths and Weaknesses, Opportunities and Threats. Here’s what it means:
(1) Strengths are those positive internal attributes that strengthen your business or team. You can develop plans to capitalize on those strengths.
(2) Weaknesses are those negative internal attributes that are working against your success. You can shore up those weaknesses so they don’t stop your success.
(3) Opportunities are those external conditions that can have a positive effect on your goals. These opportunities can point you in the right direction.
(4) Threats are those external conditions that can have a negative effect on your goals. These threats will affect you less if you can identify and minimize them. ...
We thought it would be helpful to show you a sample SWOT analysis for a business you can easily visualize: a small independent bookstore in a university town. The store owner brought the team together to think about how the bookstore could survive during the continuing financial downturn. After an hour of brainstorming, this is the SWOT analysis they developed." [cdlib.org/ cdlinfo/ 2010/ 09/ 29/ an-easy-way-to-jumpstart-your-strategic-plan-swot/ ]
The matrix diagram example "SWOT analysis for a small independent bookstore" was created using the ConceptDraw PRO diagramming and vector drawing software extended with the SWOT Analysis solution from the Management area of ConceptDraw Solution Park.
SWOT matrix

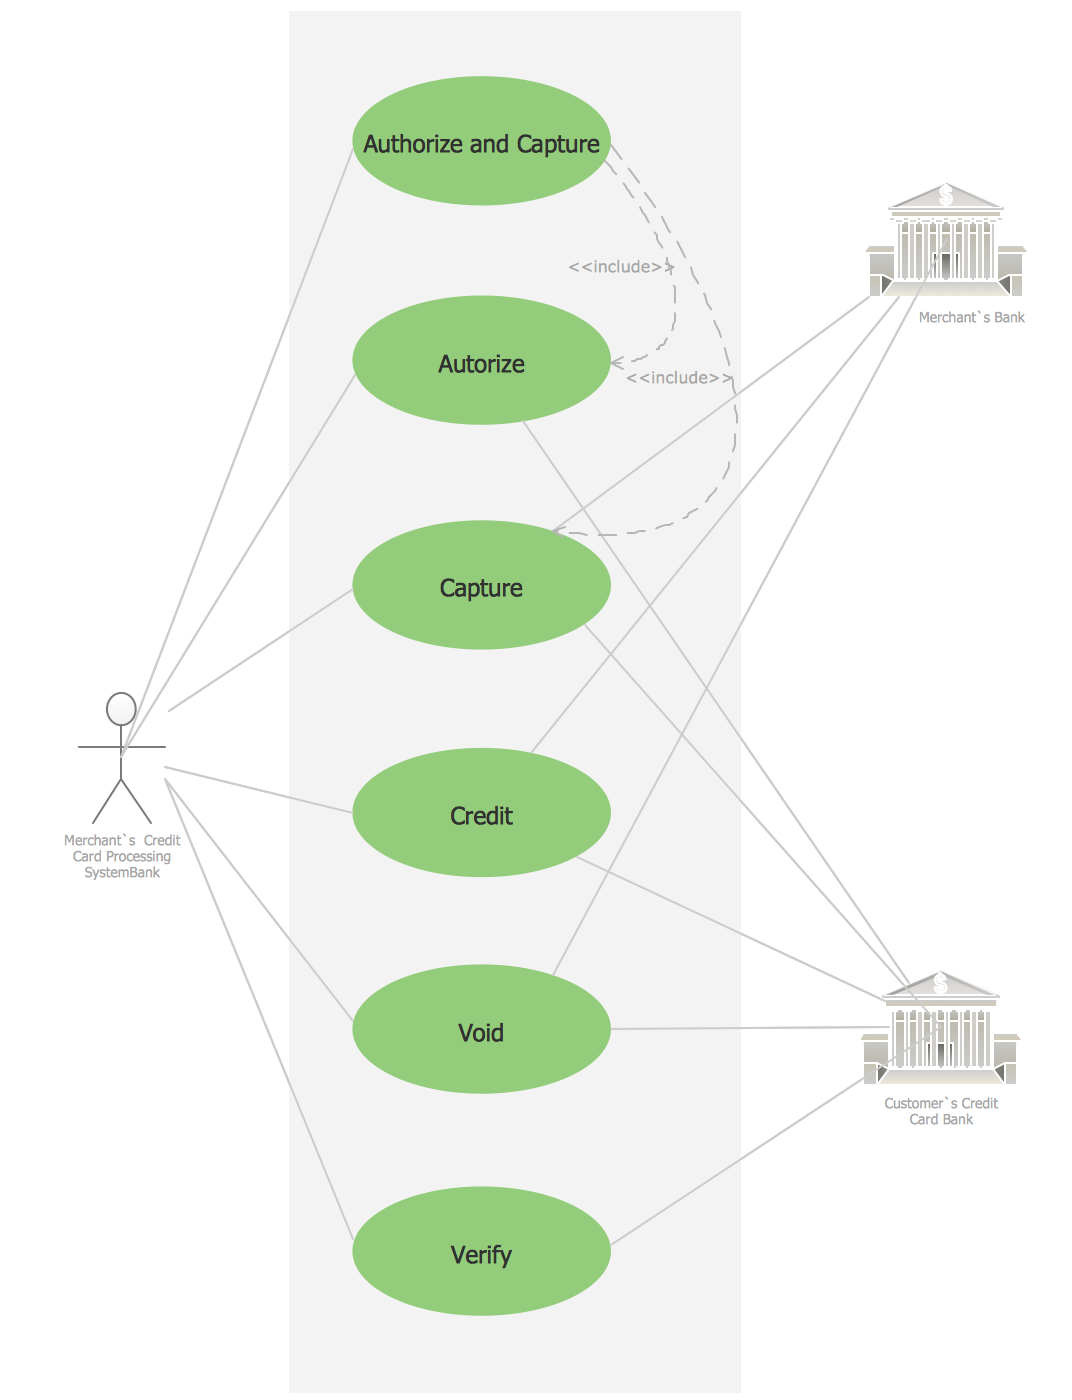
Credit Card Processing System UML Diagram
Software Diagram Examples and Templates

- Sequence Diagram Of Online Bookstore System In Uml
- Use Case Diagram For Online Book Shop Pdf
- Use Case Diagram For Book Store System
- Data Flow Diagram For Bookstore Management System
- Statechart Diagram For Online Book Store
- Dfd For Online Book Store Management System
- Uml Diagrams For Online Bookshop Pdf
- Deployment Diagram For Online Bookstore In Uml
- Online Book Store System Dfd
- Example of DFD for Online Store (Data Flow Diagram ) DFD ...