UML Diagram

Mathematics Symbols

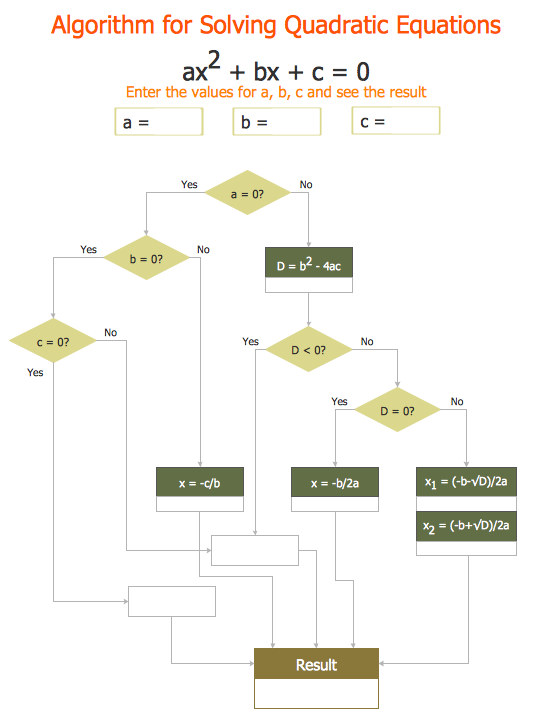
Types of Flowcharts


Mathematical Diagrams
 Mathematics
Mathematics solution extends ConceptDraw DIAGRAM software with templates, samples and libraries of vector stencils for drawing the mathematical illustrations, diagrams and charts.
Venn Diagram Examples for Problem Solving. Computer Science. Chomsky Hierarchy

Basic Flowchart Symbols and Meaning


Bar Diagram Math

Venn Diagram

2 Circle Venn Diagram. Venn Diagram Example

- Polygon types | Mathematics Symbols | IDEF4 Standard | Types Of ...
- Mathematical Diagrams | Mathematics Symbols | Bar Diagram Math ...
- Process Management Diagram And Math
- Mathematical Diagrams | Mathematics Symbols | Basic Flowchart ...
- Mathematics Symbols | Scientific Symbols Chart | Mathematics ...
- Butt weld geometry | Polygon types | Mathematics | Types Of ...
- Geometry Diagrams
- Types of Flowcharts | Physics Diagrams | | Flow Chart Related To ...
- Types Of Geometric Diagrams
- Basic Diagramming | Bar Diagram Math | Basic Flowchart Symbols ...