Influence Diagram

 Bubble Diagrams
Bubble diagrams have enjoyed great success in software engineering, architecture, economics, medicine, landscape design, scientific and educational process, for ideas organization during brainstorming, for making business illustrations, presentations, planning, design, and strategy development. They are popular because of their simplicity and their powerful visual communication attributes.
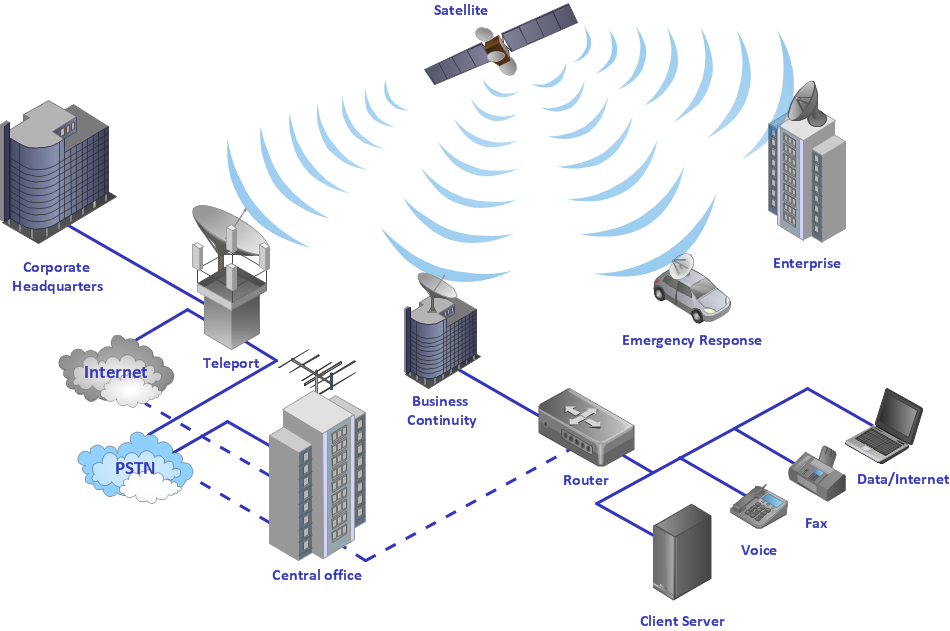
Using Both Wired and Wireless Connections
Work Flow Process Chart

Graphic Technologies
 Venn Diagrams
Venn Diagrams are actively used to illustrate simple set relationships in set theory and probability theory, logic and statistics, mathematics and computer science, linguistics, sociology, and marketing. Venn Diagrams are also often used to visually summarize the status and future viability of a project.
UML Diagram

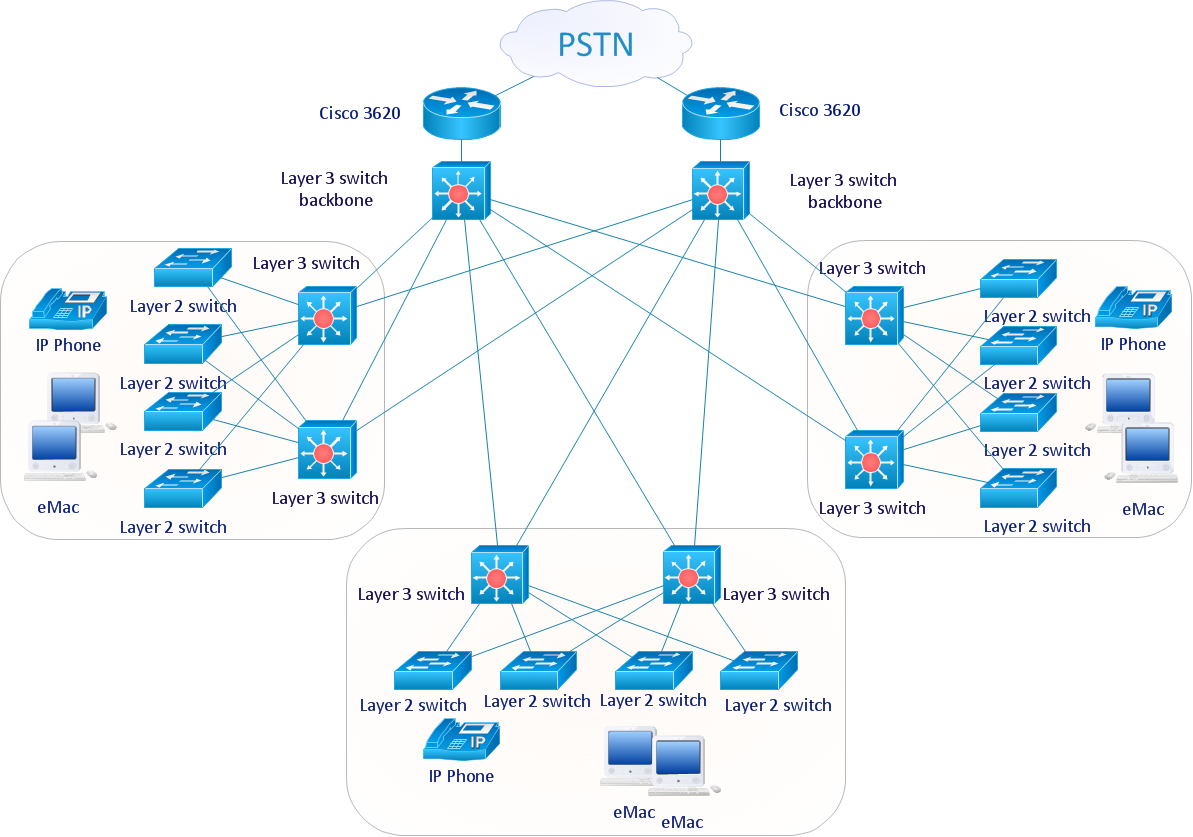
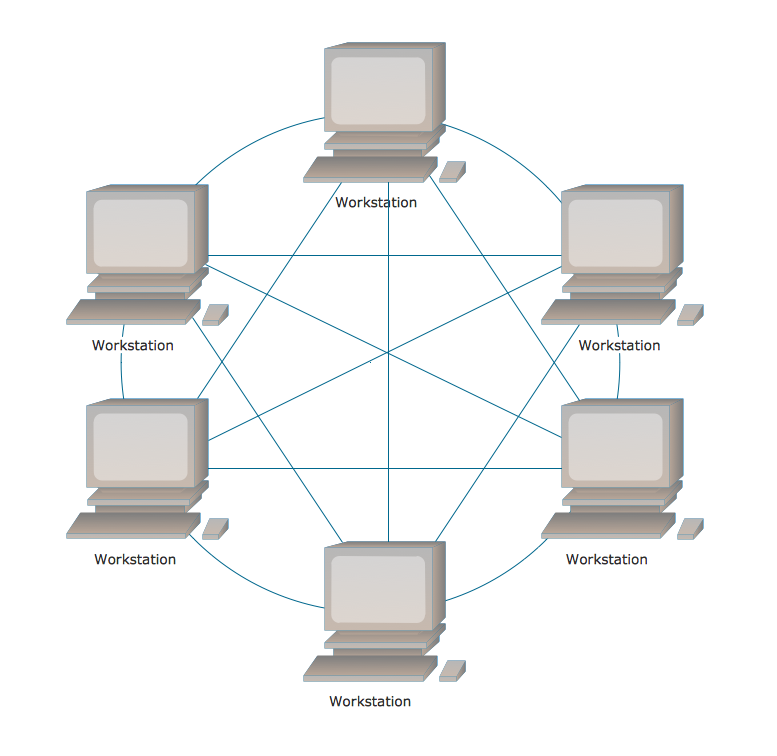
Fully Connected Network Topology Diagram
Bus Network Topology

Entity-Relationship Diagram

- Tree Diagram Compound Verb Conjunction
- Compound Sentence With Conjunction Tree Diagram
- Compound sentence | How to Diagram Sentences in ConceptDraw ...
- UML Diagram | Compound sentence | Jacobson Use Cases ...
- Tree Diagram Compound Sentences
- Tree Diagram For Compound Sentence
- Fault Tree Analysis Diagrams
- Compound sentence | How to Diagram Sentences in ConceptDraw ...
- Design elements - Sentence diagrams | How to Create a Fault Tree ...