Types of Flowcharts


Activity Network (PERT) Chart

Cross-Functional Flowchart


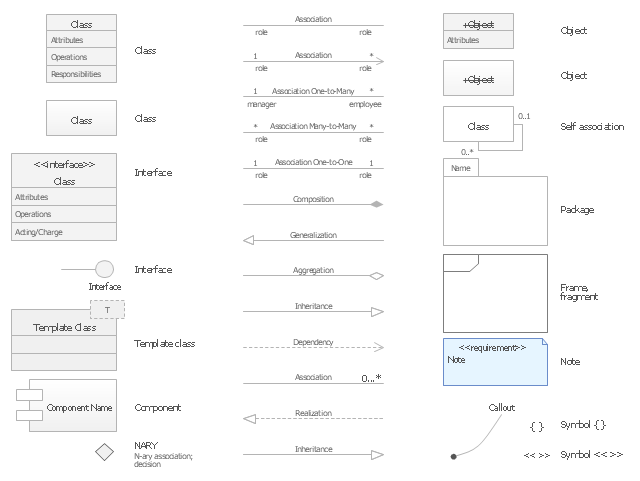
The vector stencils library "UML class diagrams" contains 38 symbols for the ConceptDraw PRO diagramming and vector drawing software.
"... classes are represented with boxes which contain three parts:
(1) The top part contains the name of the class. It is printed in Bold, centered and the first letter capitalized.
(2) The middle part contains the attributes of the class. They are left aligned and the first letter is lower case.
(3) The bottom part gives the methods or operations the class can take or undertake. They are also left aligned and the first letter is lower case. ...
To indicate a classifier scope for a member, its name must be underlined. ...
An association can be named, and the ends of an association can be adorned with role names, ownership indicators, multiplicity, visibility, and other properties. ...
Aggregation ... is graphically represented as a hollow diamond shape on the containing class end of the tree with a single line that connects the contained class to the containing class.
... graphical representation of a composition relationship is a filled diamond shape on the containing class end of the tree of lines that connect contained class(es) to the containing class.
... graphical representation of a Generalization is a hollow triangle shape on the superclass end of the line (or tree of lines) that connects it to one or more subtypes.
... graphical representation of a Realization is a hollow triangle shape on the interface end of the dashed line (or tree of lines) that connects it to one or more implementers. A plain arrow head is used on the interface end of the dashed line that connects it to its users.
Multiplicity ... representation of an association is a line with an optional arrowhead indicating the role of the object(s) in the relationship, and an optional notation at each end indicating the multiplicity of instances of that entity (the number of objects that participate in the association).
Entity classes ... are drawn as circles with a short line attached to the bottom of the circle. Alternatively, they can be drawn as normal classes with the «entity» stereotype notation above the class name." [Class diagram. Wikipedia]
The example "Design elements - UML class diagrams" is included in the Rapid UML solution from the Software Development area of ConceptDraw Solution Park.
UML class diagram symbols
 Business Processes Area
Solutions of Business Processes area extend ConceptDraw PRO software with samples, templates and vector stencils libraries for drawing business process diagrams and flowcharts for business process management.
 PM Response
The PM Response solution extends the functional abilities in project management for all three ConceptDraw products by helping to improve the response time to project changes, to plan on how to effectively respond on issues and events impacting the project. It supplies the project managers, team leaders, and all other project participants with wide abilities of iteration planning, creative collaboration, effective decision-making, discussions of the project layout approaches and solving the project challenges, lets them use mind mapping technique for iteration planning and applying the project changes, to represent the projects data as Mind Maps and use them to construct the clear plans, to convert project maps to project implementations, to use different kinds of Visual diagrams to solve the current project problems and to make correct decisions, to plan resources usage and to respond to changes in the project environment.
 Quality Mind Map
This solution extends ConceptDraw MINDMAP software with Quality Management Mind Maps (Presentations, Meeting Agendas, Problem to be solved).
 PM Dashboards
The PM Dashboards solution extends the management boundaries of ConceptDraw PRO and ConceptDraw PROJECT products with an ability to demonstrate changes to the budget status, to show the project progress toward its objectives, to display clearly the identified key performance indicator (KPI) or the set of key performance indicators for any project. This solution provides you with examples and ability to generate three types of visual dashboards reports based on your project data Project Dashboard, Tactical Dashboard, and Radar Chart. By dynamically charting the project’s key performance indicators that are collected on one ConceptDraw PRO document page, all project participants, project managers, team members, team leaders, stakeholders, and the entire organizations, for which this solution is intended, have access to the daily status of projects they are involved in.
- Diagram Of Participation Business Process
- How To Create an Involvement Matrix | Involvement matrix - Project ...
- PROBLEM ANALYSIS. Root Cause Analysis Tree Diagram ...
- CORRECTIVE ACTIONS PLANNING. Involvement Matrix | How To ...
- How to Manage Problem Solving Using Seven Management and ...
- How to Manage a Multiple Project Participants Responsibilities with ...
- Involvement matrix - Distribution of responsibilities | Responsibility ...
- How To Create an Involvement Matrix | CORRECTIVE ACTIONS ...
- Responsibility assignment matrix - Central statistical office | Seven ...
- Design elements - Choreographies BPMN 2.0 | Spatial infographics ...
- Design elements - ER diagram (Chen notation) | Components of ER ...
- CORRECTIVE ACTIONS PLANNING. Involvement Matrix ...
- PM Dashboards | How To Create Risk Diagram (PDPC) | Activity ...
- Design elements - ER diagram (Chen notation) | Entity Relationship ...
- Entity Relationship Diagram Symbols and Meaning ERD Symbols ...
- Responsibility assignment matrix - Central statistical office ...
- Entity Relationship Diagram Symbols and Meaning ERD Symbols ...
- Fundraising Pyramid | Examples of Reed-Kellogg diagrams | The ...
- Property Management Examples | House of Quality Matrix Software ...