 Status Dashboard
Status dashboard solution extends ConceptDraw DIAGRAM software with templates, samples and vector stencils libraries with graphic indicators for drawing the visual dashboards showing status data.
Road Transport - Design Elements
The vector stencils library "Status indicators" contains 41 visual status indicators. Each status indicator can visualize one of 2-6 information states and have a caption.
Use it to create your business performance dashboards in the ConceptDraw PRO diagramming and vector drawing software extended with the Status Dashboard solution from the area "What is a Dashboard" of ConceptDraw Solution Park.
Use it to create your business performance dashboards in the ConceptDraw PRO diagramming and vector drawing software extended with the Status Dashboard solution from the area "What is a Dashboard" of ConceptDraw Solution Park.
2-State Alert, Red

2-State Alert, Yellow

2-State Alert, Green

2-State Alert, Blue

3-State Alert 1

3-State Alert 2

4-State Alert 1

4-State Alert 2

5-State Alert 1

5-State Alert 2

Forth-Back 1

Forth-Back 2

Back-Forth 1

Back-Forth 2

Up-Down 1

Up-Down 2

Down-Up 1

Down-Up 2

Arrows Up-Down 1

Arrows Up-Down 2

Arrows Down-Up 1

Arrows Down-Up 2

Traffic Light Vertical 1

Traffic Light Vertical 2

Traffic Light Horizontal 1

Traffic Light Horizontal 2

Progress Lights, Green

Progress Lights, Yellow

Progress Lights, Red

5-Stars Rating

Progress Bar, Blue

Progress Bar, Green

Progress Bar, Yellow

Progress Bar, Red

Access

Quality

Switch

Speed

Light Emitting

Shapes Alert 1

Shapes Alert 2

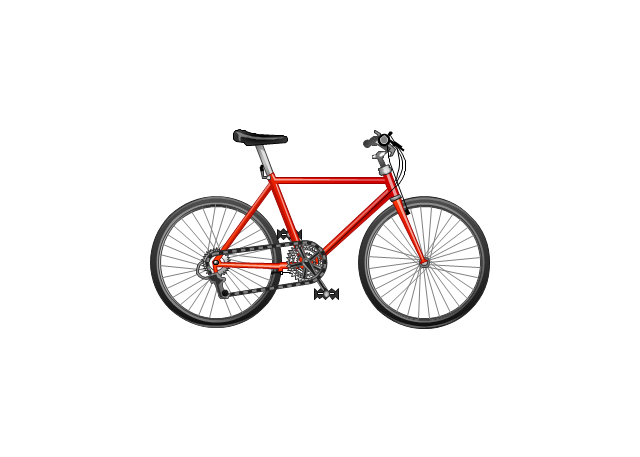
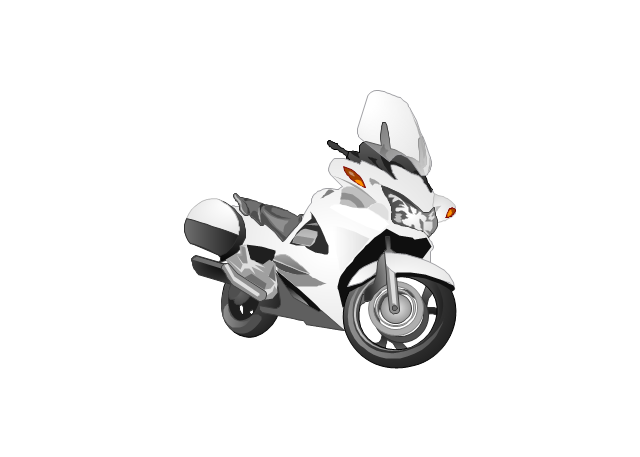
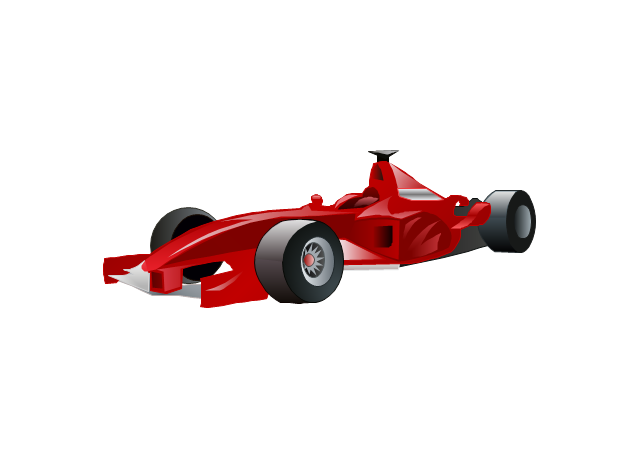
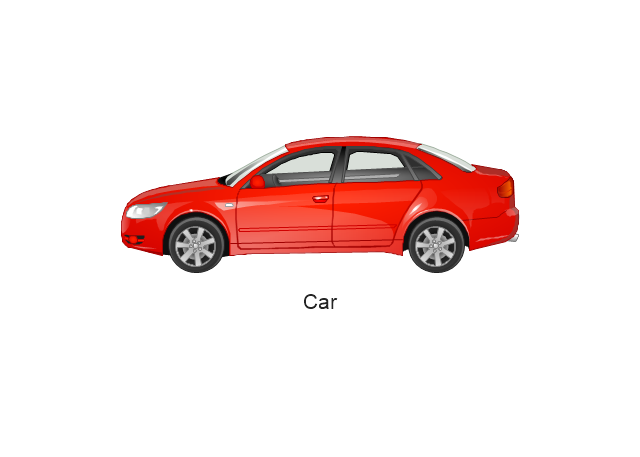
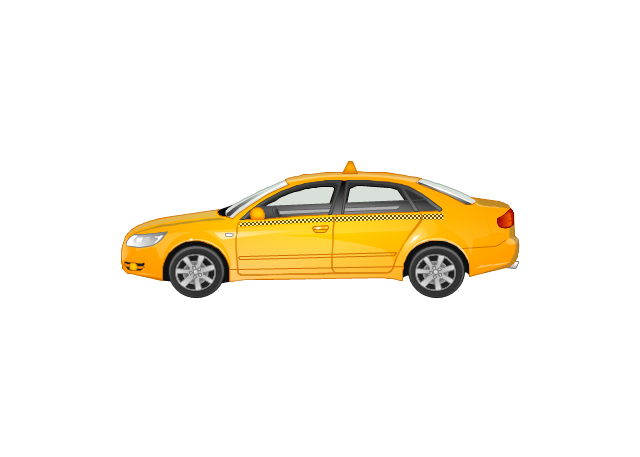
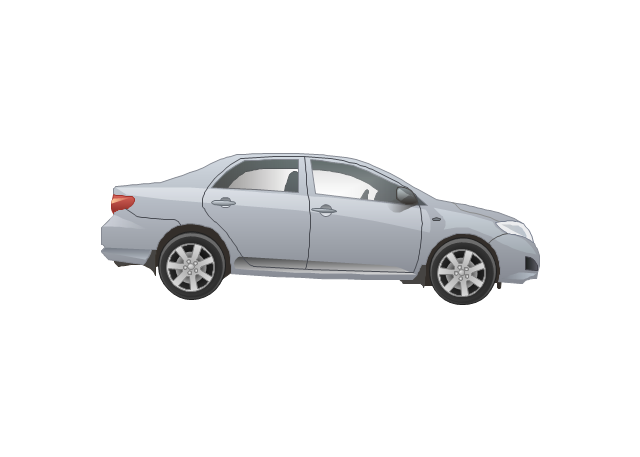
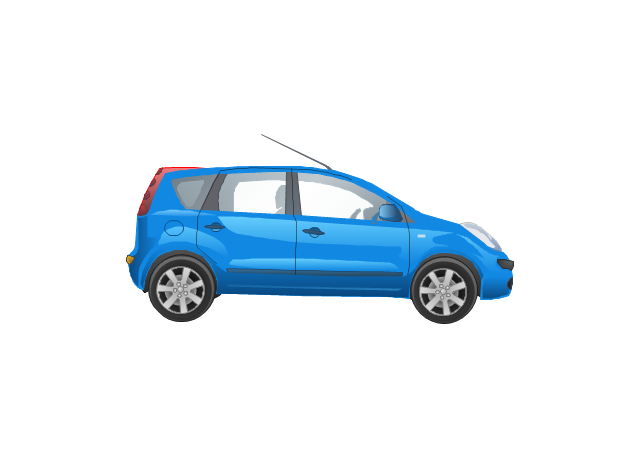
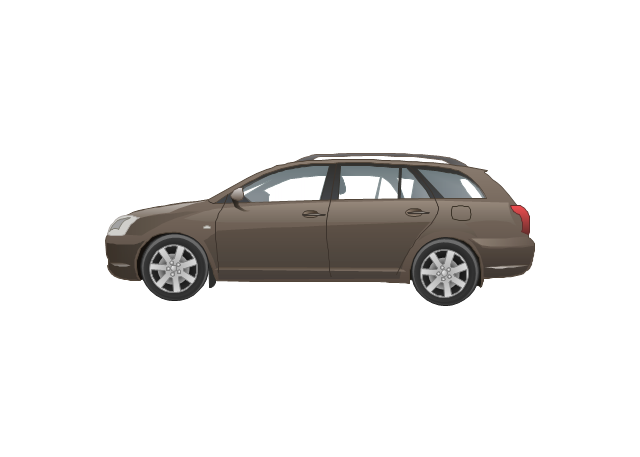
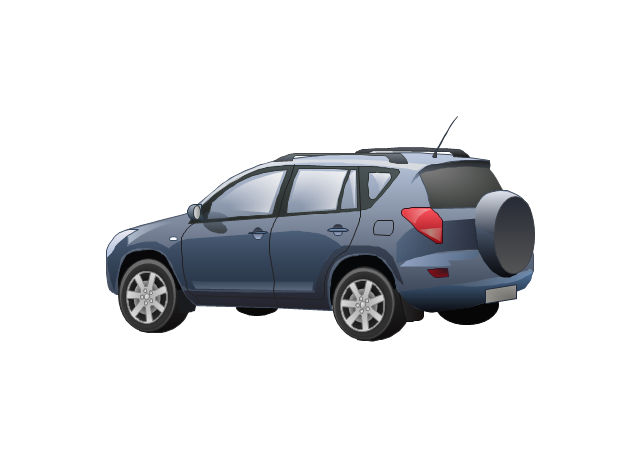
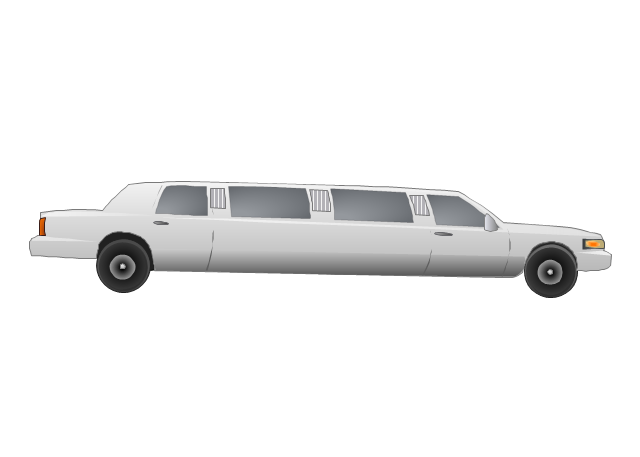
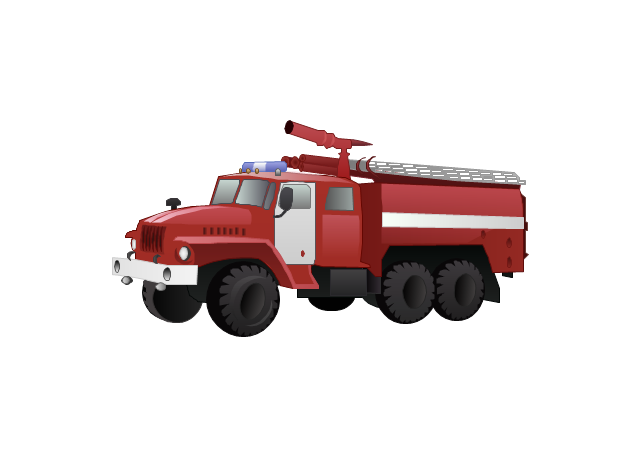
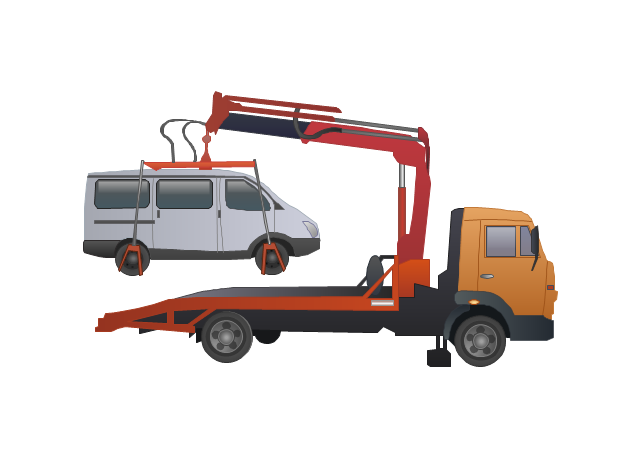
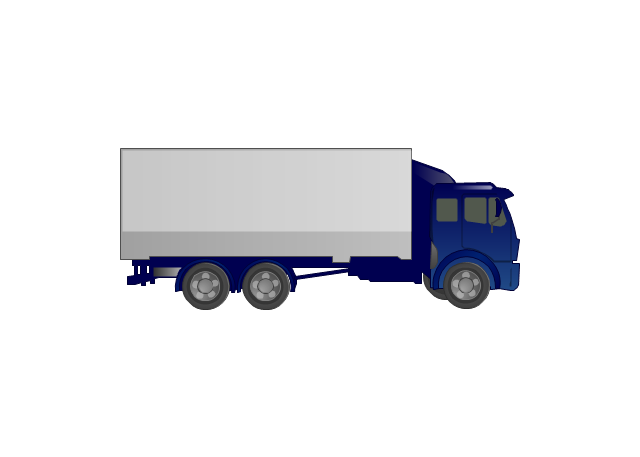
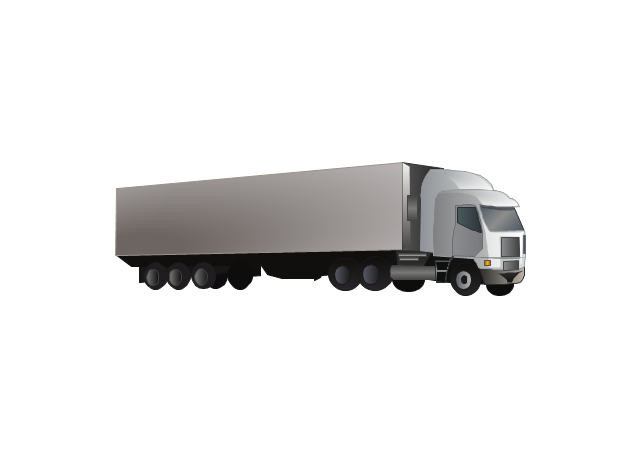
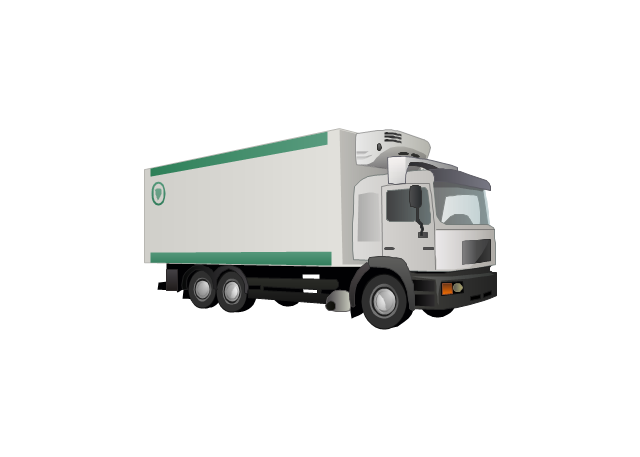
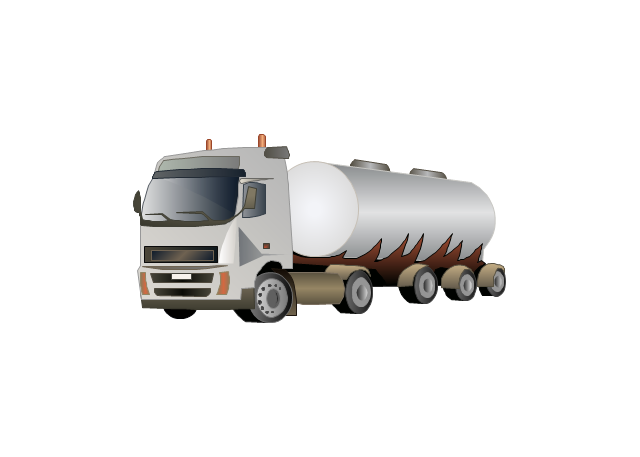
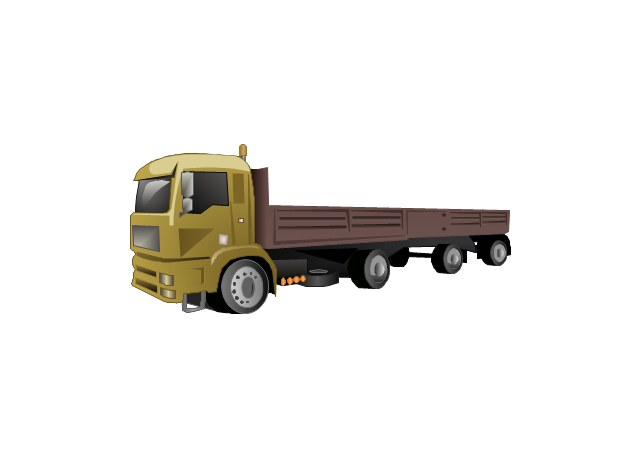
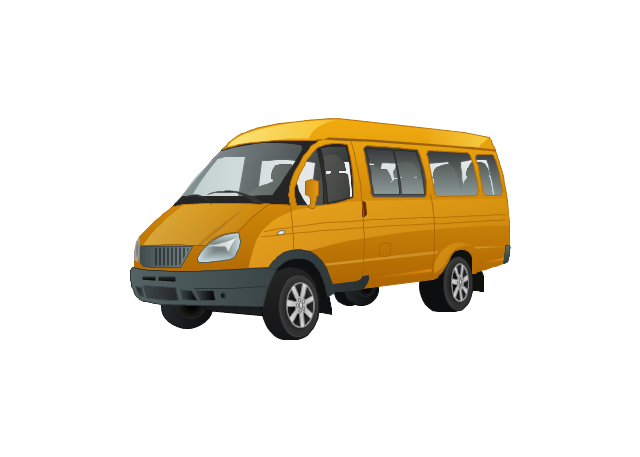
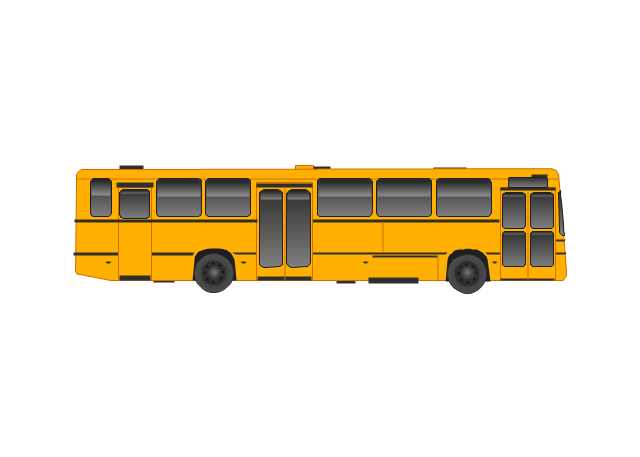
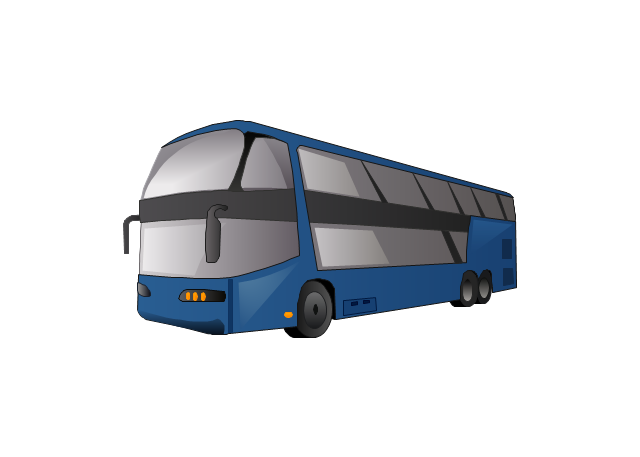
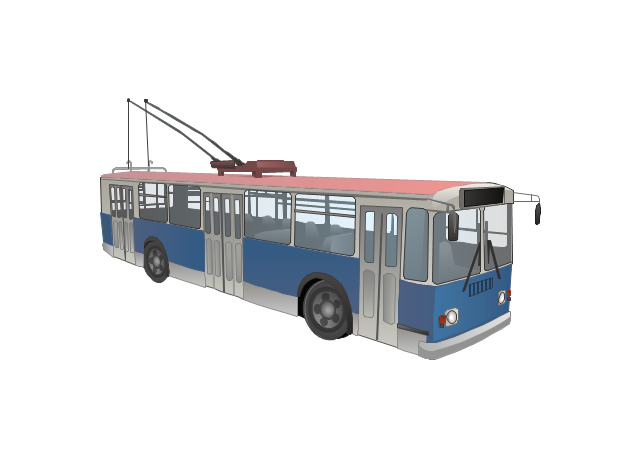
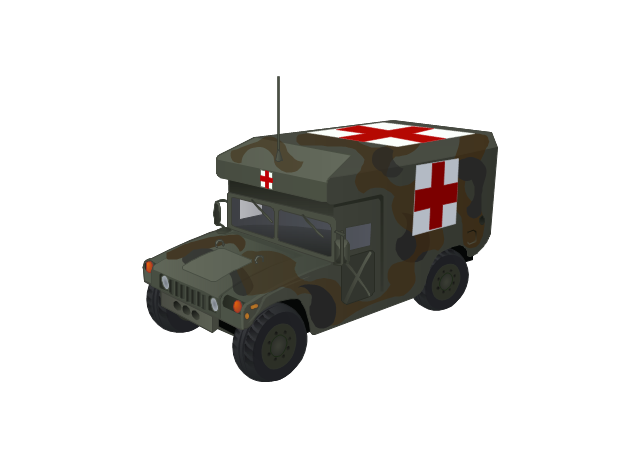
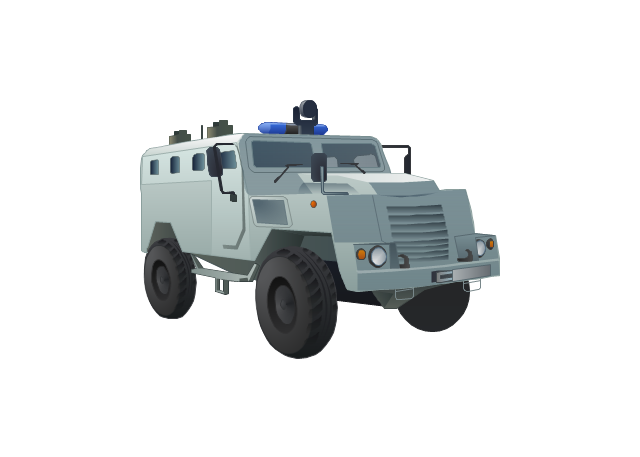
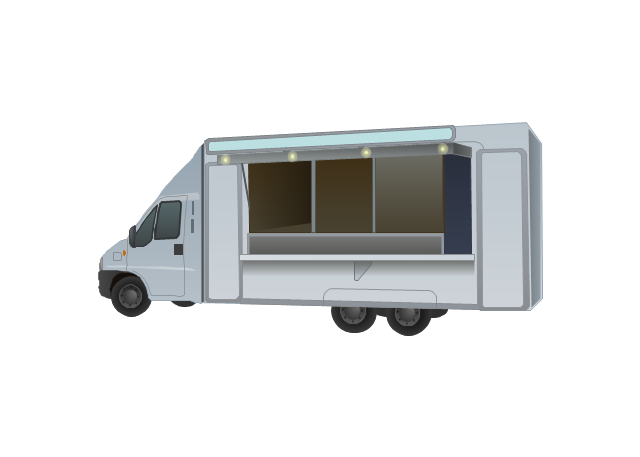
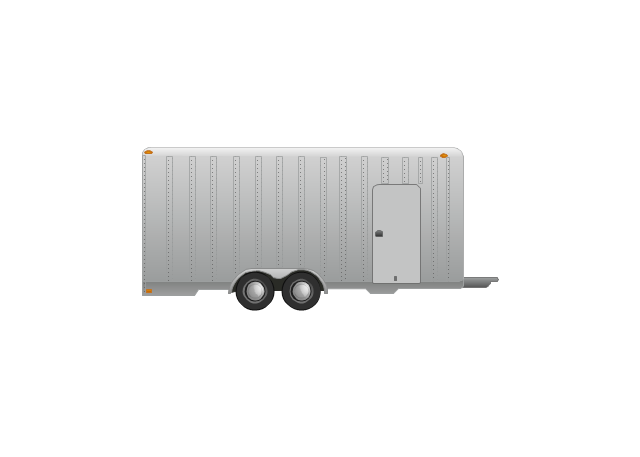
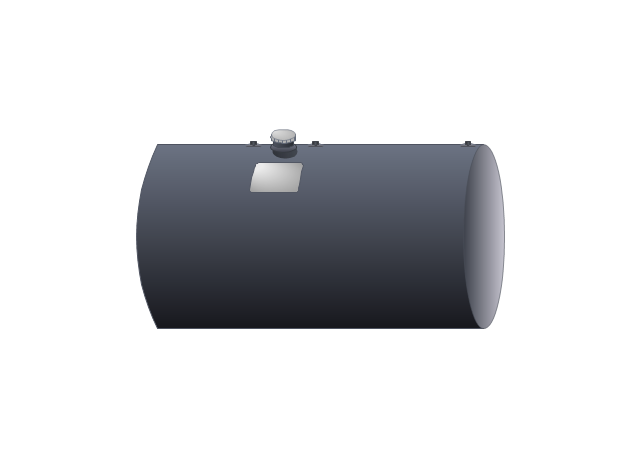
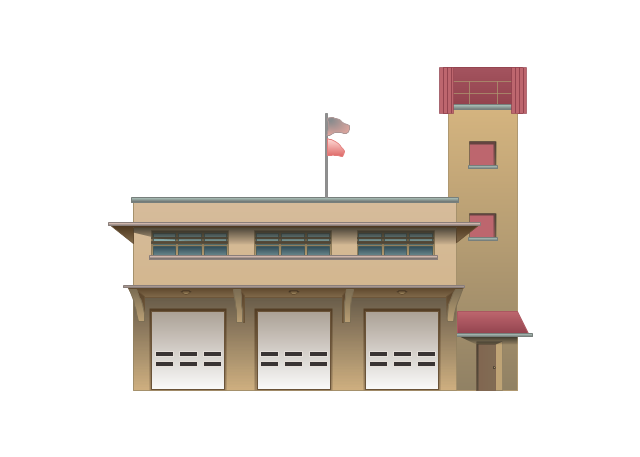
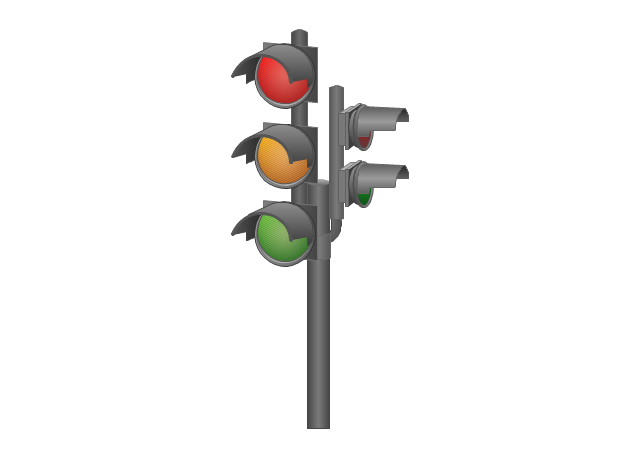
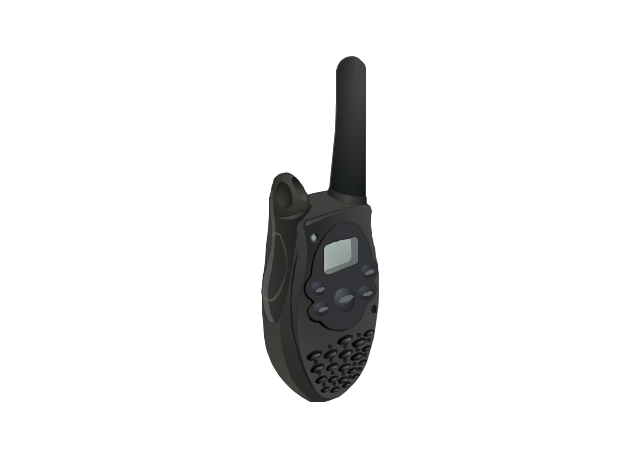
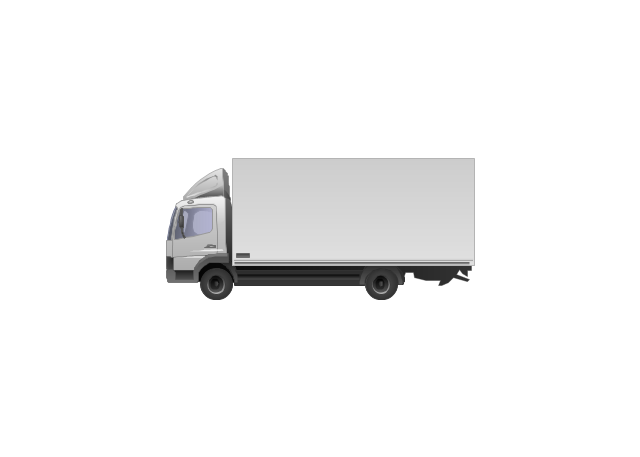
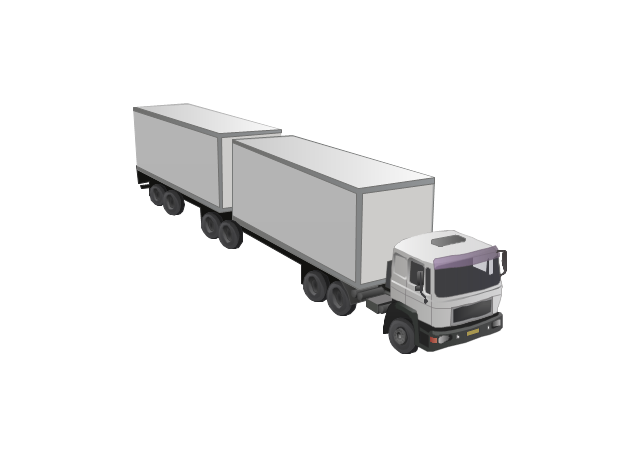
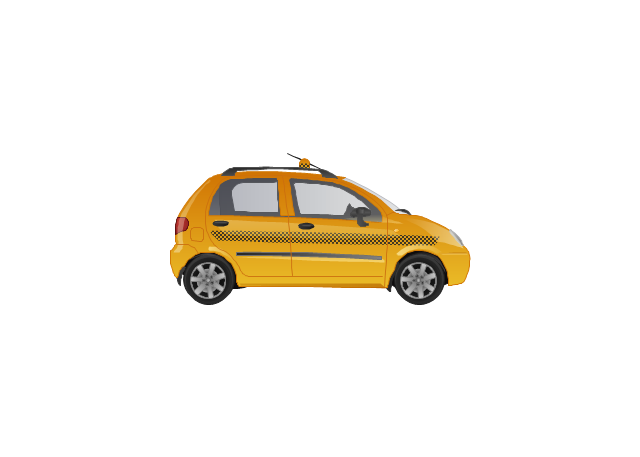
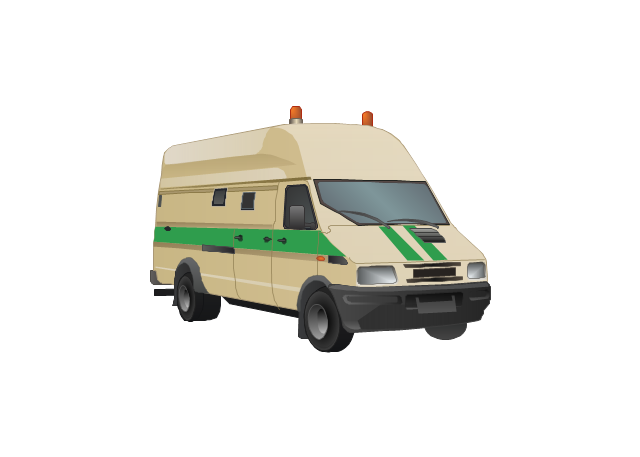
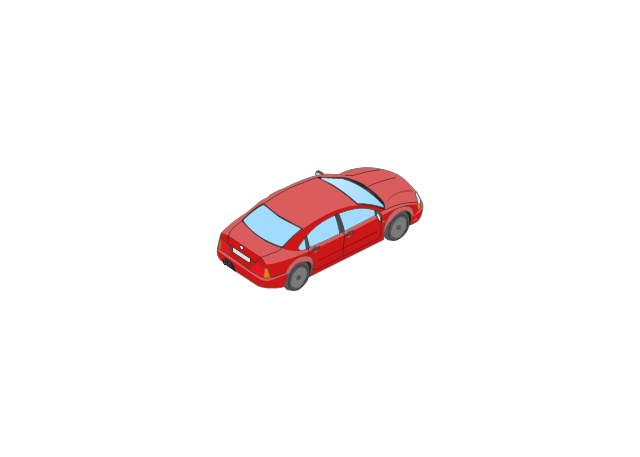
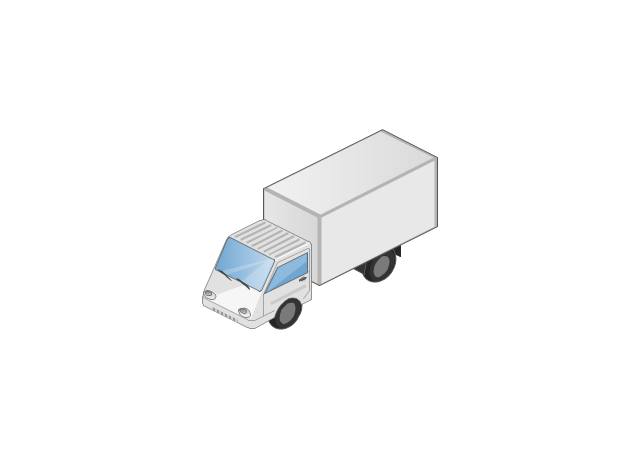
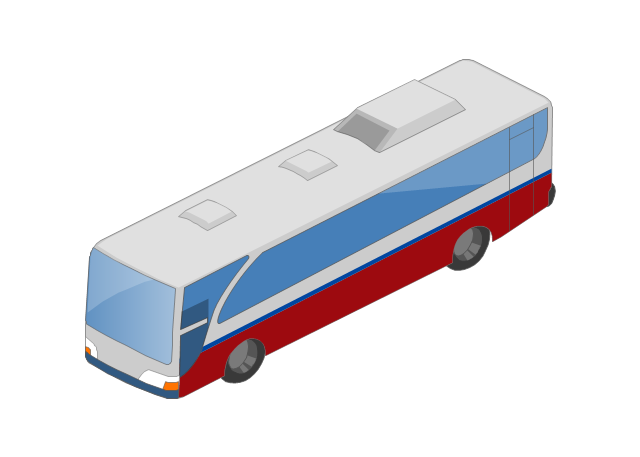
The vector stencils library "Road transport" contains 43 clip art images for creating vehicles and transportation illustrations, presentation slides, infographics and webpages using the ConceptDraw PRO diagramming and vector drawing software.
"Road transport (British English) or road transportation (American English) is the transport of passengers or goods on roads. ...
Transportation.
Transport on roads can be roughly grouped into the transportation of goods and transportation of people. In many countries licencing requirements and safety regulations ensure a separation of the two industries.
The nature of road transportation of goods depends, apart from the degree of development of the local infrastructure, on the distance the goods are transported by road, the weight and volume of the individual shipment, and the type of goods transported. For short distances and light, small shipments a van or pickup truck may be used. For large shipments even if less than a full truckload a truck is more appropriate. In some countries cargo is transported by road in horse-drawn carriages, donkey carts or other non-motorized mode. Delivery services are sometimes considered a separate category from cargo transport. In many places fast food is transported on roads by various types of vehicles. For inner city delivery of small packages and documents bike couriers are quite common.
People are transported on roads either in individual cars or automobiles, or in mass transit by bus or coach. Special modes of individual transport by road like rickshaws or velotaxis may also be locally available." [Road transport. Wikipedia]
The vector stencils library "Road transport" is included in the Aerospace and Transport solution from the Illustrations area of ConceptDraw Solution Park.
www.conceptdraw.com/ solution-park/ illustrations-aerospace-transport
Bicycle
Motorcycle
Race car
Car
Taxi
Sedan
Hatchback
Estate car
4x4
Limousine
Police car

Ambulance

Fire apparatus
Wrecker
Semi truck

Truck
Trailer
Refrigeration Truck
Petrol Tanker
Truck
Minibus
City Bus
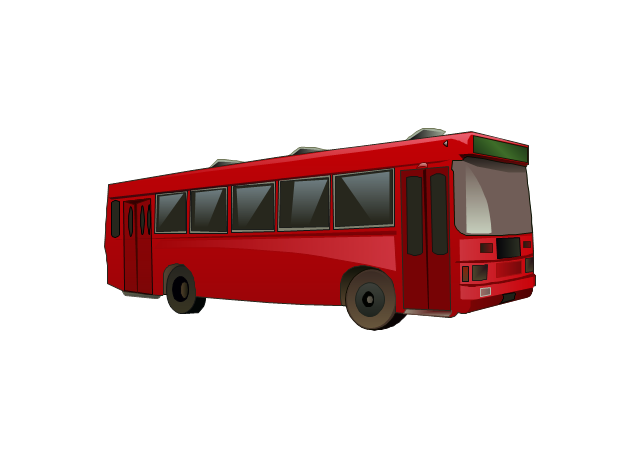
Bus
Sightseeing Bus

Double-decker Bus
Trolleybus
Military Ambulance
Armored police vehicle
First Aid Tent

Catering Vehicle
Semi-trailer
Fuel Tank
Fire Station
Signal Light
Walkie-Talkie
Lorry
B-Train
Taxi
Armored cash transport car
Car isometric
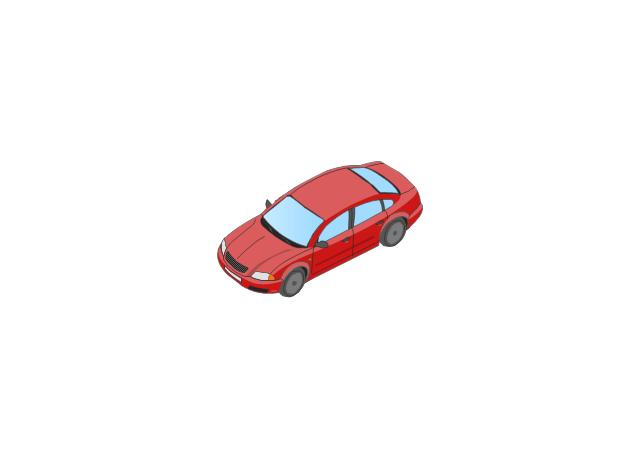
Car isometric
Box truck isometric
Bus isometric
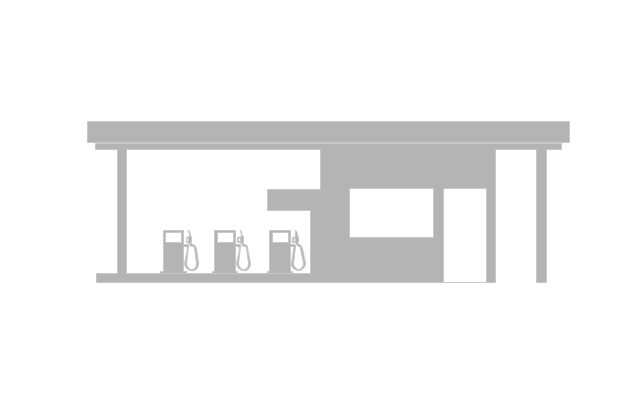
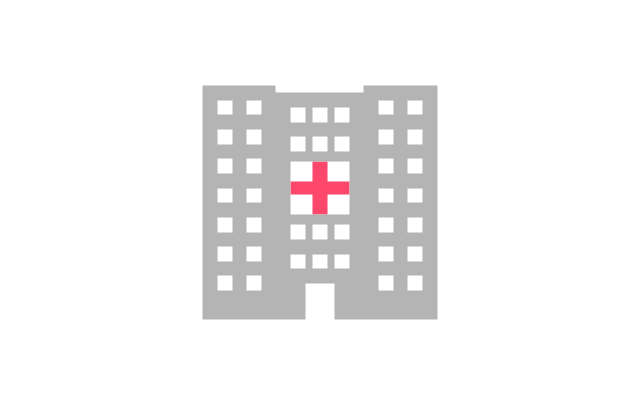
The vector stencils library "Landmarks" contains 34 landmark symbols.
Use it to mark maps for spatial infographics in the ConceptDraw PRO diagramming and vector drawing software extended with the Spatial Infographics solution from the area "What is Infographics" of ConceptDraw Solution Park.
Use it to mark maps for spatial infographics in the ConceptDraw PRO diagramming and vector drawing software extended with the Spatial Infographics solution from the area "What is Infographics" of ConceptDraw Solution Park.
Airport

Skyscraper

City

Building 1

Building 2

House 1

House 2

Factory

Petrol Station
Fire Station

Hospital
Town Hall

Cathedral

Shopping Centre

Convenience Store

Park

Traffic Light
Bus 1

Bus 2

Tram 1
Tram 2

Train

Train/Tram

Car 1
Car 2

Car 3

Bicycle

Ferry/Boat

Airplane

Funicular

Ropeway/Cableway

River

Lake

Stadium
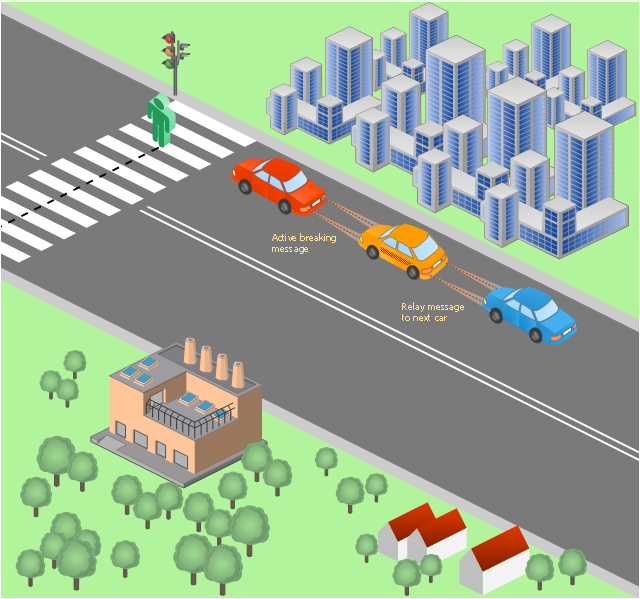
This vehicular network diagram sample was drawn on the base of picture illustrating the post "LED Traffic Signals and Vehicle Lights for Optical Broadband Communications" from the blog "Terranautix".
"Visible Light Communication (VLC) is a rapidly emerging field that focuses on the use of light sources (between 400 THz and 800 THz) for the primary purpose of broadband communications. In order to transmit data over light, the light source (transceiver) is pulsed on and off rapidly to create a data stream, similar to fiber optic communications, but in the wireless form, or “Free-Space Optical Transmission“. By pulsing lights many thousands (and millions) of times per second, data transmission occurs at a rate undetectable by the human eye. Optical receivers convert the light pulses to an electronic signal on the receiver end. The Light Emitting Diode (LED) is the primary form factor currently undergoing extensive research."
[terranautix.com/ tag/ communications]
The vehicular network diagram example "Visible light communication" was created using the ConceptDraw PRO diagramming and vector drawing software extended with the Vehicular Networking solution from the Computer and Networks area of ConceptDraw Solution Park.
Vehicular network diagram
Used Solutions
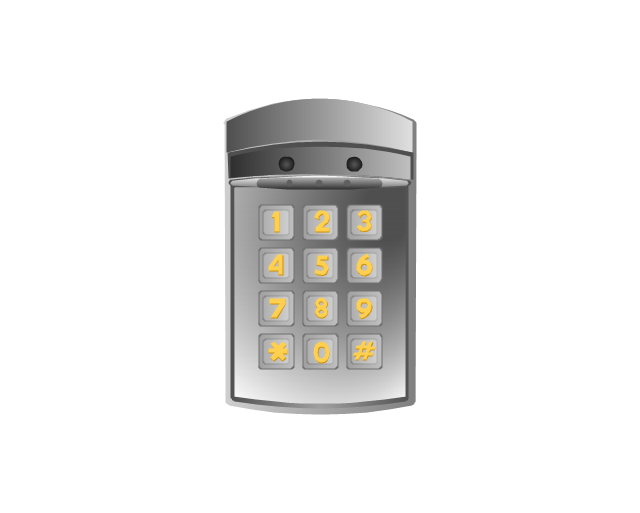
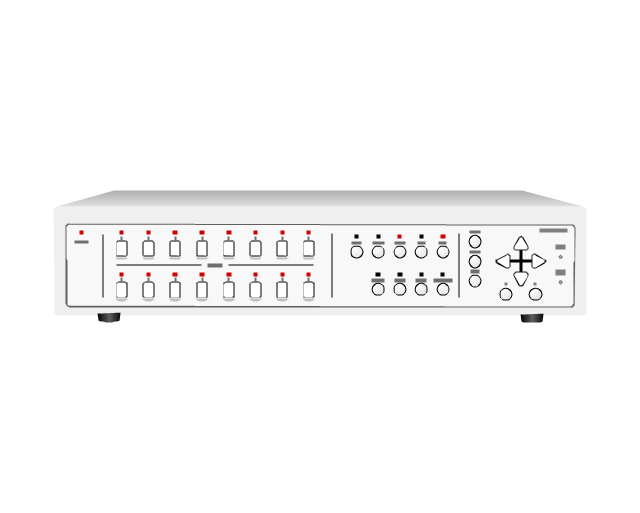
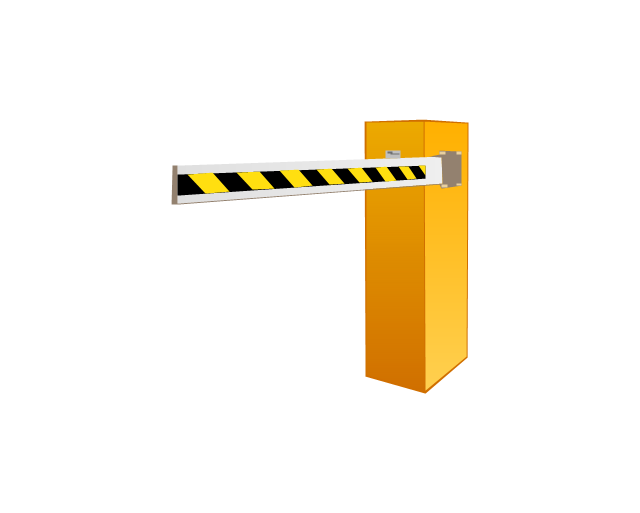
The vector stencils library "Access and security" contains 17 clipart images of access control and security system equipment which you can easy use in your diagrams and illustrations.
"Physical security describes security measures that are designed to deny unauthorized access to facilities, equipment and resources, and to protect personnel and property from damage or harm (such as espionage, theft, or terrorist attacks). Physical security involves the use of multiple layers of interdependent systems which include CCTV surveillance, security guards, protective barriers, locks, access control protocols, and many other techniques." [Physical security. Wikipedia]
The clip art example "Access and security - Vector stencils library" was created in the ConceptDraw PRO diagramming and vector drawing software using the Presentation Clipart solution from the Illustration area of ConceptDraw Solution Park.
www.conceptdraw.com/ solution-park/ illustrations-presentation-clipart
Digital keyless entry
Card reader 1
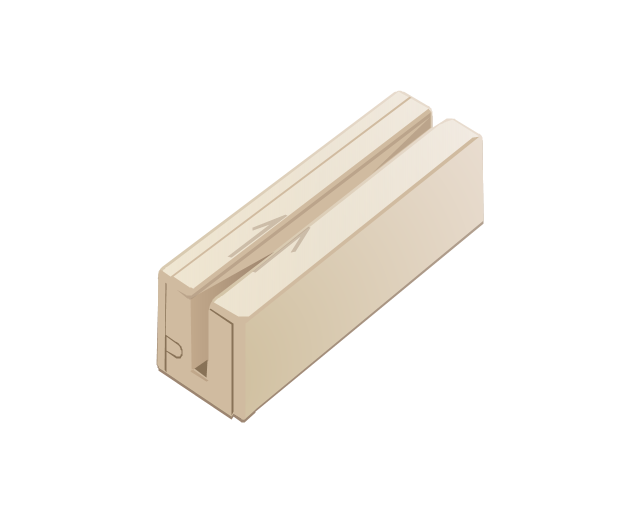
Card reader 2

Multiplexer
Alarm light, blue

Alarm light, yellow

Alarm light, red

Vehicle detector
Loop detector
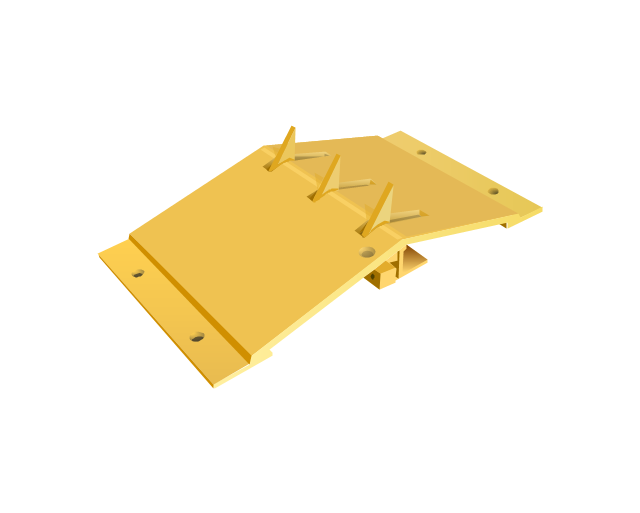
Traffic spikes
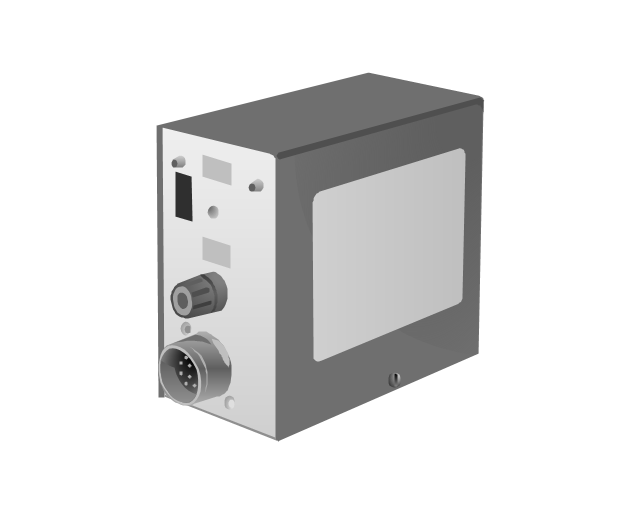
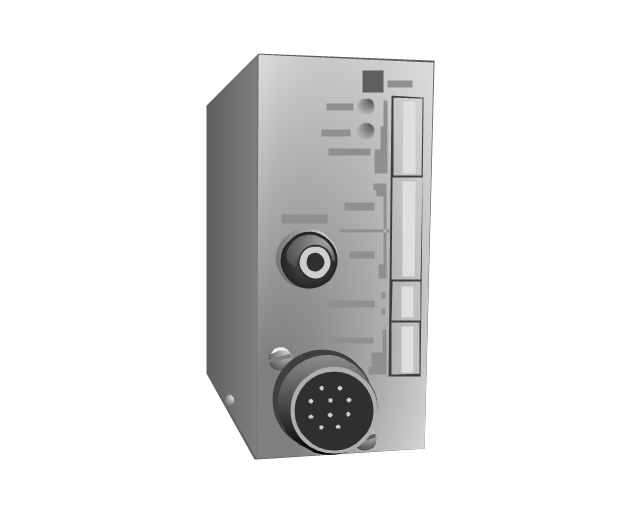
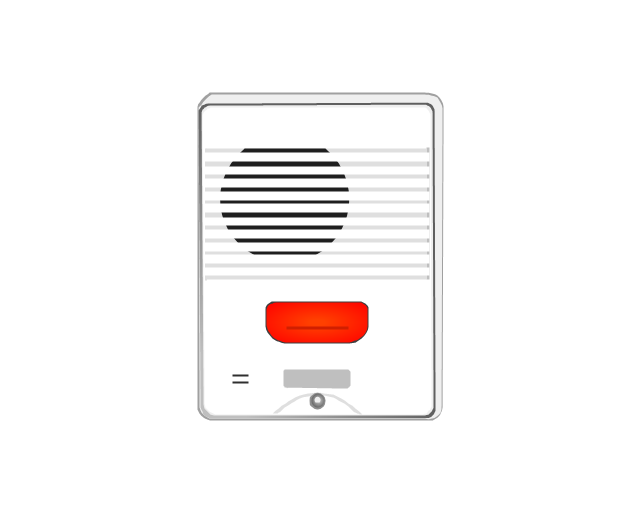
Intercom
Telephone entry system
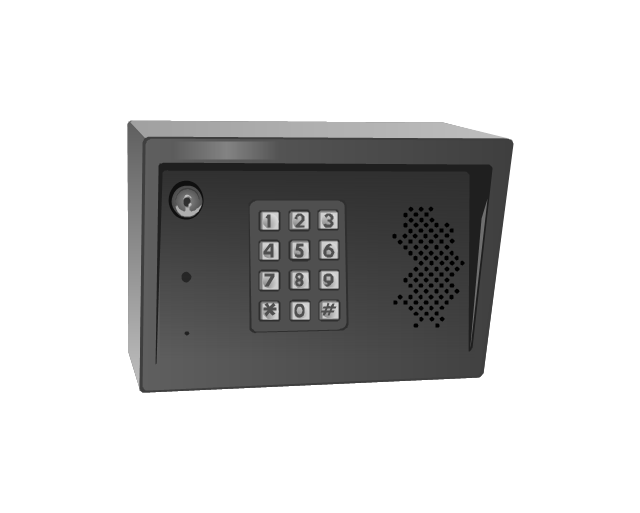
Keyless entry system

Swing gate operator
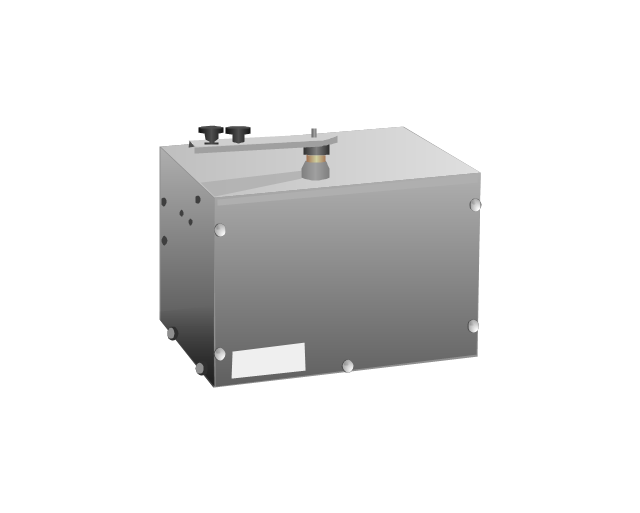
Slide gate operator
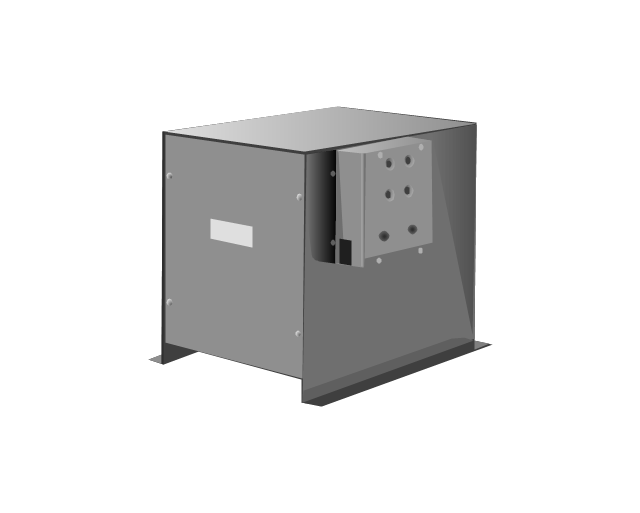
Barrier gate operator
Transmitters
The vector stencils library "Scrum workspace" contains 21 icons.
Use this clipart set to design your agile software development diagrams and infographics with ConceptDraw PRO software.
"... a list of all the things that ... should be visible within the ideal agile workspace:
Big Visible Charts. ... the sprint burndown chart, showing the number of hours remaining as of each day of the current sprint. ... big visible charts showing the number of passing customer acceptance tests, the pass/ fail status of tests by day, sprint and release burndown charts, number of new stories introduced to the product backlog per sprint, and more.
Additional feedback devices. In addition to big, visible charts, it is common for an agile team to use additional visual feedback devices in their workspace. One of the most common is a lava lamp that is turned on whenever the automated build is broken.
... flashing red traffic lights to indicate exceptional conditions such as an issue on a production server. Also popular are ambient orbs and Nabaztag rabbits, which are wireless programmable devices that can also be configured to change colors, speak messages, or wiggle their ears as a team desires. ...
Everyone on your team. Each person on the team should ideally be able to see each other person on the team. This absolutely includes the ScrumMaster and ideally includes the product owner. ...
The sprint backlog. One of the best ways to ensure that everything necessary is completed in the sprint is to make the sprint backlog visible. The best way to do that is by displaying the sprint backlog on a wall, ideally in the form of a task board ...
The product backlog. One problem with running an endless series of sprints is that each can feel disconnected or isolated from the whole of a planned released or related set of new capabilities. A good way to reduce the impact of this problem is by displaying the product backlog somewhere clearly visible. ... tack the index cards with those upcoming user stories on a wall where all can see them. This allows team members to see how the user stories they are working on in the current sprint relate to others that are coming soon.
At least one big white board. ... Locating this in the team’s common workspace encourages spontaneous meetings." [mountaingoatsoftware.com/ blog/ the-ideal-agile-workspace]
The clip art sample "Design elements - Scrum workspace" is included in the Scrum solution from the Project Management area of ConceptDraw Solution Park.
Icon set
The vector stencils library "Status indicators" contains 41 visual status indicators. Each status indicator can visualize one of 2-6 information states and have a caption.
Use it to create your business performance dashboards in the ConceptDraw PRO diagramming and vector drawing software extended with the Status Dashboard solution from the area "What is a Dashboard" of ConceptDraw Solution Park.
Use it to create your business performance dashboards in the ConceptDraw PRO diagramming and vector drawing software extended with the Status Dashboard solution from the area "What is a Dashboard" of ConceptDraw Solution Park.
2-State Alert, Red
2-State Alert, Yellow
2-State Alert, Green
2-State Alert, Blue
3-State Alert 1
3-State Alert 2
4-State Alert 1
4-State Alert 2
5-State Alert 1
5-State Alert 2
Forth-Back 1
Forth-Back 2
Back-Forth 1
Back-Forth 2
Up-Down 1
Up-Down 2
Down-Up 1
Down-Up 2
Arrows Up-Down 1
Arrows Up-Down 2
Arrows Down-Up 1
Arrows Down-Up 2
Traffic Light Vertical 1
Traffic Light Vertical 2
Traffic Light Horizontal 1
Traffic Light Horizontal 2
Progress Lights, Green
Progress Lights, Yellow
Progress Lights, Red
5-Stars Rating
Progress Bar, Blue
Progress Bar, Green
Progress Bar, Yellow
Progress Bar, Red
Access
Quality
Switch
Speed
Light Emitting
Shapes Alert 1
Shapes Alert 2
 Vehicular Networking
The Vehicular Networking solution extends the ConceptDraw DIAGRAM software functionality with specialized tools, wide variety of pre-made vector objects, collection of samples and templates in order to help network engineers design vehicular network diagrams for effective network engineering activity, visualize vehicular networks, develop smart transportation systems, design various types of vehicle network management diagrams, regional network diagrams, vehicular communication system diagrams, vehicular ad-hoc networks, vehicular delay-tolerant networks, and other network engineering schemes.