"Markings.
Lines.
The centre line divides the ice in half crosswise. It is used to judge icing, meaning that if a team sends the puck across the centre line (red line), blue line and then across the goal line (that is to say, shoots or dumps the puck past the goal line from behind their own side of the centre line) it is said to be icing. ...
Faceoff spots and circles.
There are 9 faceoff spots on a hockey rink. Most faceoffs take place at these spots. There are two spots in each end zone, two at each end of the neutral zone, and one in the centre of the rink.
There are faceoff circles around the centre ice and end zone faceoff spots. There are hash marks painted on the ice near the end zone faceoff spots. The circles and hash marks show where players may legally position themselves during a faceoff or in game play. ...
Spot and circle dimensions.
Both the center faceoff spot and center faceoff circle are blue. The spot is a solid blue circle 12 inches (30 cm) in diameter. Within the spot is a center, a circle 30 feet (9.1 m) in diameter, painted with a blue line 2 inches (5.1 cm) in width.
All of the other faceoff spots have outlines 2 inches (5.1 cm) thick, forming a circle 2 feet (0.61 m) in diameter measured from the outsides of the outlines, and are filled in with red in all areas except for the 3 inches (7.6 cm) space from the tops and bottoms of the circles, measured from the insides of the outline. ...
Goal posts and nets.
At each end of the ice, there is a goal consisting of a metal goal frame and cloth net in which each team must place the puck to earn points. According to NHL and IIHF rules, the entire puck must cross the entire goal line in order to be counted as a goal. ...
Goal area.
The crease is a special area of the ice designed to allow the goaltender to perform without interference. In most leagues, goals are disallowed if an attacking player enters the goal crease with a stick, skate, or any body part before the puck. For the purposes of this rule, the crease extends vertically from the painted lines to the top of the goal frame. ...
Goaltender trapezoid.
During the 2004-05 American Hockey League (AHL) season, an experimental rule was implemented for the first seven weeks of the season, instituting a goaltender trap zone, more commonly called the trapezoid in reference to its shape. Under the rule, it is prohibited for the goaltender to handle the puck anywhere behind the goal line that is not within the trapezoidal area. If they do so they are assessed a minor penalty for delay of game. ...
Referee's crease.
The referee's crease is a semicircle ten feet in radius in front of the scorekeepers bench." [Ice hockey rink. Wikipedia]
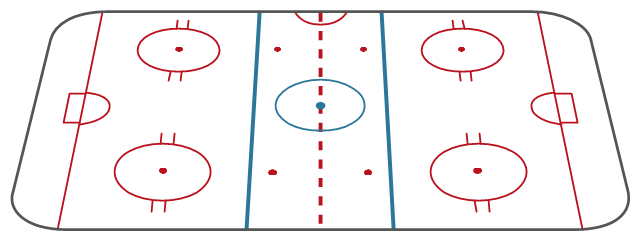
The diagram template "Ice hockey rink view from long side" for the ConceptDraw PRO diagramming and vector drawing software is included in the Hockey solution from the Sport area of ConceptDraw Solution Park.
Lines.
The centre line divides the ice in half crosswise. It is used to judge icing, meaning that if a team sends the puck across the centre line (red line), blue line and then across the goal line (that is to say, shoots or dumps the puck past the goal line from behind their own side of the centre line) it is said to be icing. ...
Faceoff spots and circles.
There are 9 faceoff spots on a hockey rink. Most faceoffs take place at these spots. There are two spots in each end zone, two at each end of the neutral zone, and one in the centre of the rink.
There are faceoff circles around the centre ice and end zone faceoff spots. There are hash marks painted on the ice near the end zone faceoff spots. The circles and hash marks show where players may legally position themselves during a faceoff or in game play. ...
Spot and circle dimensions.
Both the center faceoff spot and center faceoff circle are blue. The spot is a solid blue circle 12 inches (30 cm) in diameter. Within the spot is a center, a circle 30 feet (9.1 m) in diameter, painted with a blue line 2 inches (5.1 cm) in width.
All of the other faceoff spots have outlines 2 inches (5.1 cm) thick, forming a circle 2 feet (0.61 m) in diameter measured from the outsides of the outlines, and are filled in with red in all areas except for the 3 inches (7.6 cm) space from the tops and bottoms of the circles, measured from the insides of the outline. ...
Goal posts and nets.
At each end of the ice, there is a goal consisting of a metal goal frame and cloth net in which each team must place the puck to earn points. According to NHL and IIHF rules, the entire puck must cross the entire goal line in order to be counted as a goal. ...
Goal area.
The crease is a special area of the ice designed to allow the goaltender to perform without interference. In most leagues, goals are disallowed if an attacking player enters the goal crease with a stick, skate, or any body part before the puck. For the purposes of this rule, the crease extends vertically from the painted lines to the top of the goal frame. ...
Goaltender trapezoid.
During the 2004-05 American Hockey League (AHL) season, an experimental rule was implemented for the first seven weeks of the season, instituting a goaltender trap zone, more commonly called the trapezoid in reference to its shape. Under the rule, it is prohibited for the goaltender to handle the puck anywhere behind the goal line that is not within the trapezoidal area. If they do so they are assessed a minor penalty for delay of game. ...
Referee's crease.
The referee's crease is a semicircle ten feet in radius in front of the scorekeepers bench." [Ice hockey rink. Wikipedia]
The diagram template "Ice hockey rink view from long side" for the ConceptDraw PRO diagramming and vector drawing software is included in the Hockey solution from the Sport area of ConceptDraw Solution Park.
Ice hockey rink diagram template
A four level pyramid model of different types of Information Systems based on the different levels of hierarchy in an organization. The first level represents transaction processing systems for workers. The second level represents management information systems for middle managers. The third level represents decision support systems for senior menegers. The fourth level represents executive information systems for executives.
"The "classic" view of Information systems found in the textbooks in the 1980s was of a pyramid of systems that reflected the hierarchy of the organization, usually transaction processing systems at the bottom of the pyramid, followed by management information systems, decision support systems, and ending with executive information systems at the top. Although the pyramid model remains useful, since it was first formulated a number of new technologies have been developed and new categories of information systems have emerged, some of which no longer fit easily into the original pyramid model.
Some examples of such systems are:
data warehouses,
enterprise resource planning,
enterprise systems,
expert systems,
search engines,
geographic information system,
global information system,
office automation." [Information systems. Wikipedia]
This diagram was redesigned using the ConceptDraw PRO diagramming and vector drawing software from Wikimedia Commons file Four-Level-Pyramid-model.png. [commons.wikimedia.org/ wiki/ File:Four-Level-Pyramid-model.png]
This file is licensed under the Creative Commons Attribution-Share Alike 3.0 Unported license. [creativecommons.org/ licenses/ by-sa/ 3.0/ deed.en]
The triangle chart example "Information systems types" is included in the Pyramid Diagrams solution from the Marketing area of ConceptDraw Solution Park.
Pyramid diagram

The vector stencils library "Mac OS X Lion user interface" contains 52 UI design elements.
Use it for designing Mac OS X Lion graphic user interface (GUI) of software for Apple computers in the ConceptDraw PRO diagramming and vector drawing software extended with the Graphic User Interface solution from the Software Development area of ConceptDraw Solution Park.
Use it for designing Mac OS X Lion graphic user interface (GUI) of software for Apple computers in the ConceptDraw PRO diagramming and vector drawing software extended with the Graphic User Interface solution from the Software Development area of ConceptDraw Solution Park.
Title Bar
Title Bar Inactive

Window

Window Inactive

Window Title Bar

Window Title Bar (Inactive)
-mac-os-x-lion-user-interface---vector-stencils-library.png--diagram-flowchart-example.png)
Full Screen Button

Exit Full Screen Button

Window without Bar

Window (Narrow Toolbar)
-mac-os-x-lion-user-interface---vector-stencils-library.png--diagram-flowchart-example.png)
Window Inactive (Narrow Toolbar)
-mac-os-x-lion-user-interface---vector-stencils-library.png--diagram-flowchart-example.png)
Panel (Hud Window)
-mac-os-x-lion-user-interface---vector-stencils-library.png--diagram-flowchart-example.png)
Panel (Hud Window) (Inactive)
-(inactive)-mac-os-x-lion-user-interface---vector-stencils-library.png--diagram-flowchart-example.png)
Box 1

Box 2

Field
List View 1

List View 2

Scroll Bar Vertical

Scroll Bar Horizontal

Main Menu
Menu Bar

Menu

Vertical Line

Horizontal Line

Apple Menu

Arrow mark
Combo Box

Pop Up Menu

Text Field

Count Button

Search Field

Check Box

Check Box

Group of Check Boxes

Radio Button

Radio Button

Group of Radio Buttons

Linear Slider (round thumb)
-mac-os-x-lion-user-interface---vector-stencils-library.png--diagram-flowchart-example.png)
Linear Slider (directional thumb)
-mac-os-x-lion-user-interface---vector-stencils-library.png--diagram-flowchart-example.png)
Circular Slider

Color Well

Relevance Indicator

Rating Indicator

Indeterminate Progress Bar

Determinate Progress Bar

Continuous Capacity Indicator

Discrete Capacity Indicator

Discrete Capacity Indicator (yellow)
-mac-os-x-lion-user-interface---vector-stencils-library.png--diagram-flowchart-example.png)
Discrete Capacity Indicator (red)
-mac-os-x-lion-user-interface---vector-stencils-library.png--diagram-flowchart-example.png)
Asynchronous Progress Indicator

Circular Progress Indicator

How To Create Restaurant Floor Plan in Minutes


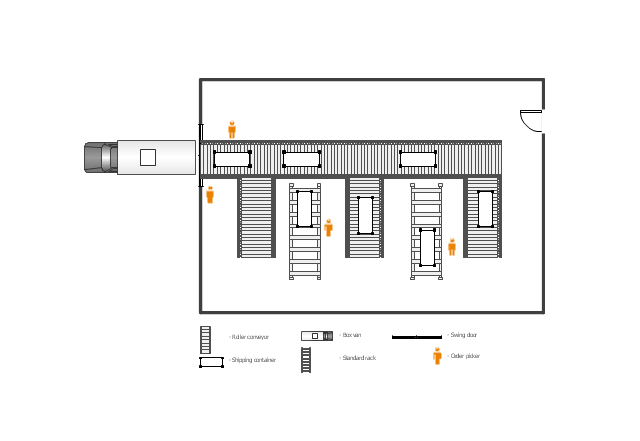
This floor plan example was drawn on the base of slide 27 "Warehouse Layout Floor Plan" of the presentation "Operations Management. Layout Strategy. Chapter 9" from the website of the School of Business Administration at Portland State University. [sba.pdx.edu/ faculty/ karlt/ Ch9/ sld027.htm]
"A conveyor system is a common piece of mechanical handling equipment that moves materials from one location to another. Conveyors are especially useful in applications involving the transportation of heavy or bulky materials. Conveyor systems allow quick and efficient transportation for a wide variety of materials, which make them very popular in the material handling and packaging industries. Many kinds of conveying systems are available, and are used according to the various needs of different industries. There are chain conveyors (floor and overhead) as well. Chain conveyors consist of enclosed tracks, I-Beam, towline, power & free, and hand pushed trolleys." [Conveyor system. Wikipedia]
The floor plan example "Warehouse with conveyor system" was created using the ConceptDraw PRO diagramming and vector drawing software extended with the Plant Layout Plans solution from the Building Plans area of ConceptDraw Solution Park.
Floor plan - Warehouse with conveyor system
The vector stencils library "Tab Bar Icons" contains 18 iOS apps GUI elements - tab bar icons: bookmark, contacts, downloads, favorites, featured, history, more, most recent, most viewed, recents, search, top rated, near me, top charts, keypad, voicemail, radio, artists.
Use the library "Tab Bar Icons" to draw tab bar elements for design of iPhone software applications user interface sketches, mockups and prototypes.
The iOS GUI views sample "Design elements - Tab Bar Icons" was created using the ConceptDraw PRO diagramming and vector drawing software extended with the iPhone User Interface solution from the Software Development area of ConceptDraw Solution Park.
iOS GUI views: tab bar icons
Process Flowchart


- Top View Floor Plan Of Interior Arrangement Of A First Aid Room
- Top View Of Sofa
- Office Layout Plans | Top View Plan Of Interior Arrangement Of A ...
- Bedroom - Vector stencils library | Single Bed Top View
- Terrace Furniture Layouts Top View Drawings
- Sofa Top View Vector
- Basketball Court Top View Png
- Buffet Layout Top View Drawing
- Top View Table And Chairs
- Download Free Furniture Top View Png
- Furniture Top View Png
- Top View People Png
- Offices Building Drawing In Top View
- Top View Building Plan
- Door Plant Top View Png
- Computer Café Diagram In Top View
- House Interior Design Drawing Top View
- Indoor Office Layout Drawing Top View
- Computer Cafe Diagram With A Server In Top View
- Top View Home Landscape Design