Infographic Generator

HelpDesk
How to Create a Timeline Diagram in ConceptDraw PRO

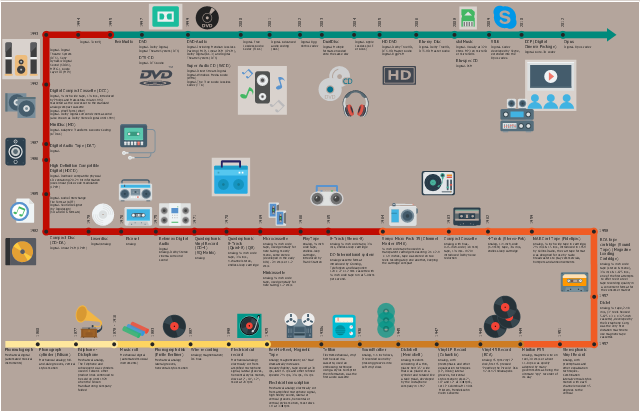
This infographic sample was designed on the base of data from the Wikipedia article "Timeline of audio formats".
"An audio format is a medium for storing sound and music. The term is applied to both the physical recording media and the recording formats of the audio content – in computer science it is often limited to the audio file format, but its wider use usually refers to the physical method used to store the data.
Music is recorded and distributed using a variety of audio formats, some of which store additional information." [Timeline of audio formats. Wikipedia]
The infographic example "Audio format developments" was created using the ConceptDraw PRO diagramming and vector drawing software extended with the Audio, Video, Media solution from the Illustrations area of ConceptDraw Solution Park.
Infographic
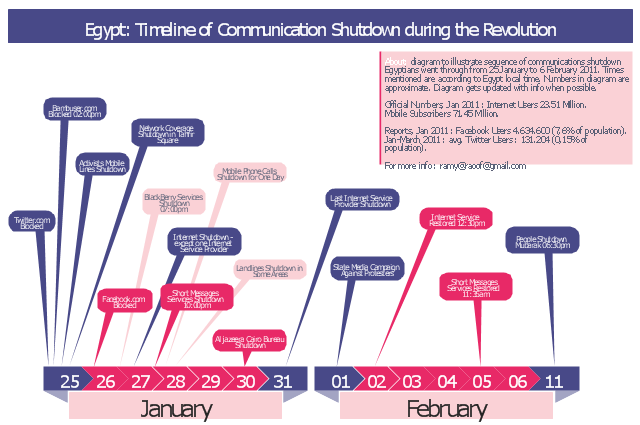
This typography infographics example was redesigned from the Wikimedia Commons file: Egypt timeline of communication shutdown during jan25revolution.jpg. [commons.wikimedia.org/ wiki/ File:Egypt_ timeline_ of_ communication_ shutdown_ during_ jan25revolution.jpg]
This file is licensed under the Creative Commons Attribution 3.0 Unported license. [creativecommons.org/ licenses/ by/ 3.0/ deed.en]
Diagram to illustrate sequence of communications shutdown Egyptians went through from 25 January to 06 February 2011. Times mentioned are according to Egypt local time. Numbers in the diagram are approximate. Last update of the diagram October 2011.
"2011 Internet shutdown.
Diagram to illustrate sequence of communications shutdown Egyptians went through from 25 January to 06 February 2011. Times mentioned are according to Egypt local time. Numbers in the diagram are approximate. Last update of the diagram October 2011.
The 2011 Egyptian protests began on 25 January 2011. As a result, on January 25 and 26, the government blocked Twitter in Egypt and later Facebook was blocked as well.
On January 27, various reports claimed that access to the Internet in the entire country had been shut down. ...
On February 2, connectivity was re-established by the four main Egyptian service providers. A week later, the heavy filtering that occurred at the height of the revolution had ended and bloggers and online activists who had been arrested were released." [Internet in Egypt. Wikipedia]
The example "Egypt timeline of communication shutdown during jan 25 revolution" was created using the ConceptDraw PRO diagramming and vector drawing software extended with the Typography Infographics solition from the area "What is infographics" in ConceptDraw Solution Park.
Infographics
Typography Infographic Examples

 What are Infographic Area
Solutions of the area What is Infographics from ConceptDraw Solution Park collect templates, samples and vector stencils libraries with design elements for the drawing information graphics.
 Timeline Diagrams
Timeline Diagrams solution extends ConceptDraw PRO software with templates, samples and library of vector stencils for drawing the timeline and milestones diagrams.
How to draw Metro Map style infographics? Moscow, New York, Los Angeles, London

 Spatial Infographics
Spatial infographics solution extends ConceptDraw PRO software with infographic samples, map templates and vector stencils libraries with design elements for drawing spatial information graphics.
- Timeline Infographic Generator
- Infographic Generator | How to Create a Timeline Diagram in ...
- Process Timeline Infographic
- Project Timeline | Infographic Generator | Process Flowchart ...
- Infographic Generator | Project Timeline | Process Flowchart ...
- Timeline Examples | How to Make a Timeline | Project Timeline ...
- What are Infographic Area | Sales Dashboard | An Example Of A ...
- What are Infographic Area | Business Processes Area | Sales ...
- What are Infographic Area | Sales Dashboard | Www Timelines ...
- Infographic Generator | Project Timeline | ConceptDraw Solution ...
- Infographic Generator | Management Consultant | Timeline ...
- Timeline Examples | Project Timeline | How to Make a Timeline ...
- Infographic Generator | Program Evaluation and Review Technique ...
- Timeline Creation
- Project Timeline | Timeline Examples | How to Make a Timeline ...
- Infographic Generator | Continent Maps | How To Draw Egyptian ...
- Timeline Examples | Timeline Diagrams | Project Timeline | Timeline ...
- How to Make a Timeline | Timeline Diagrams | Timeline Examples ...
- Project Timeline | Timeline Examples | Timeline Diagrams | Free ...
- Infographic Generator | Examples of Flowcharts, Org Charts and ...