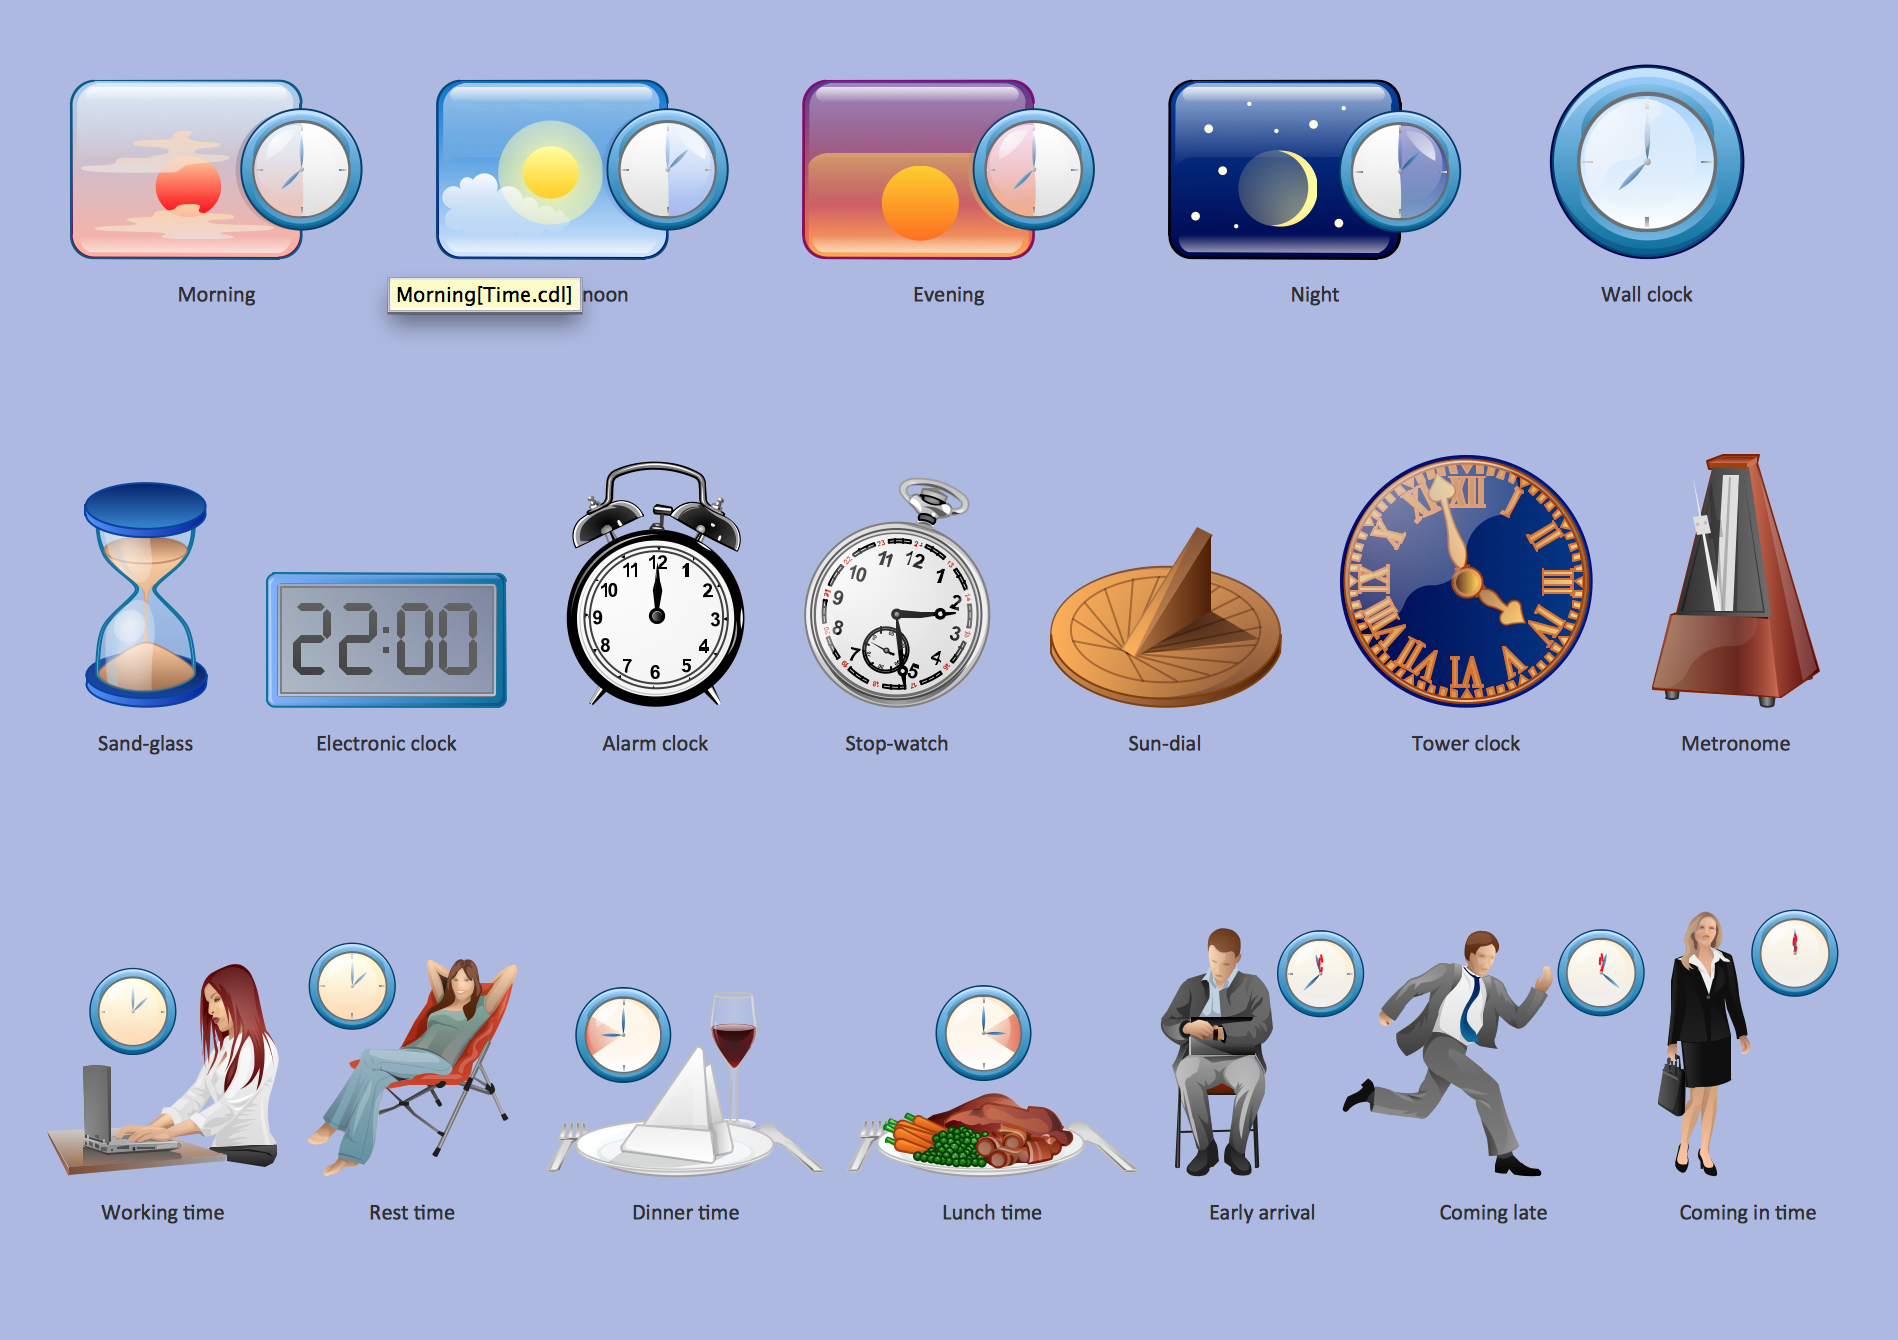
Time - Design Elements
Export from ConceptDraw DIAGRAM Document to a Graphic File


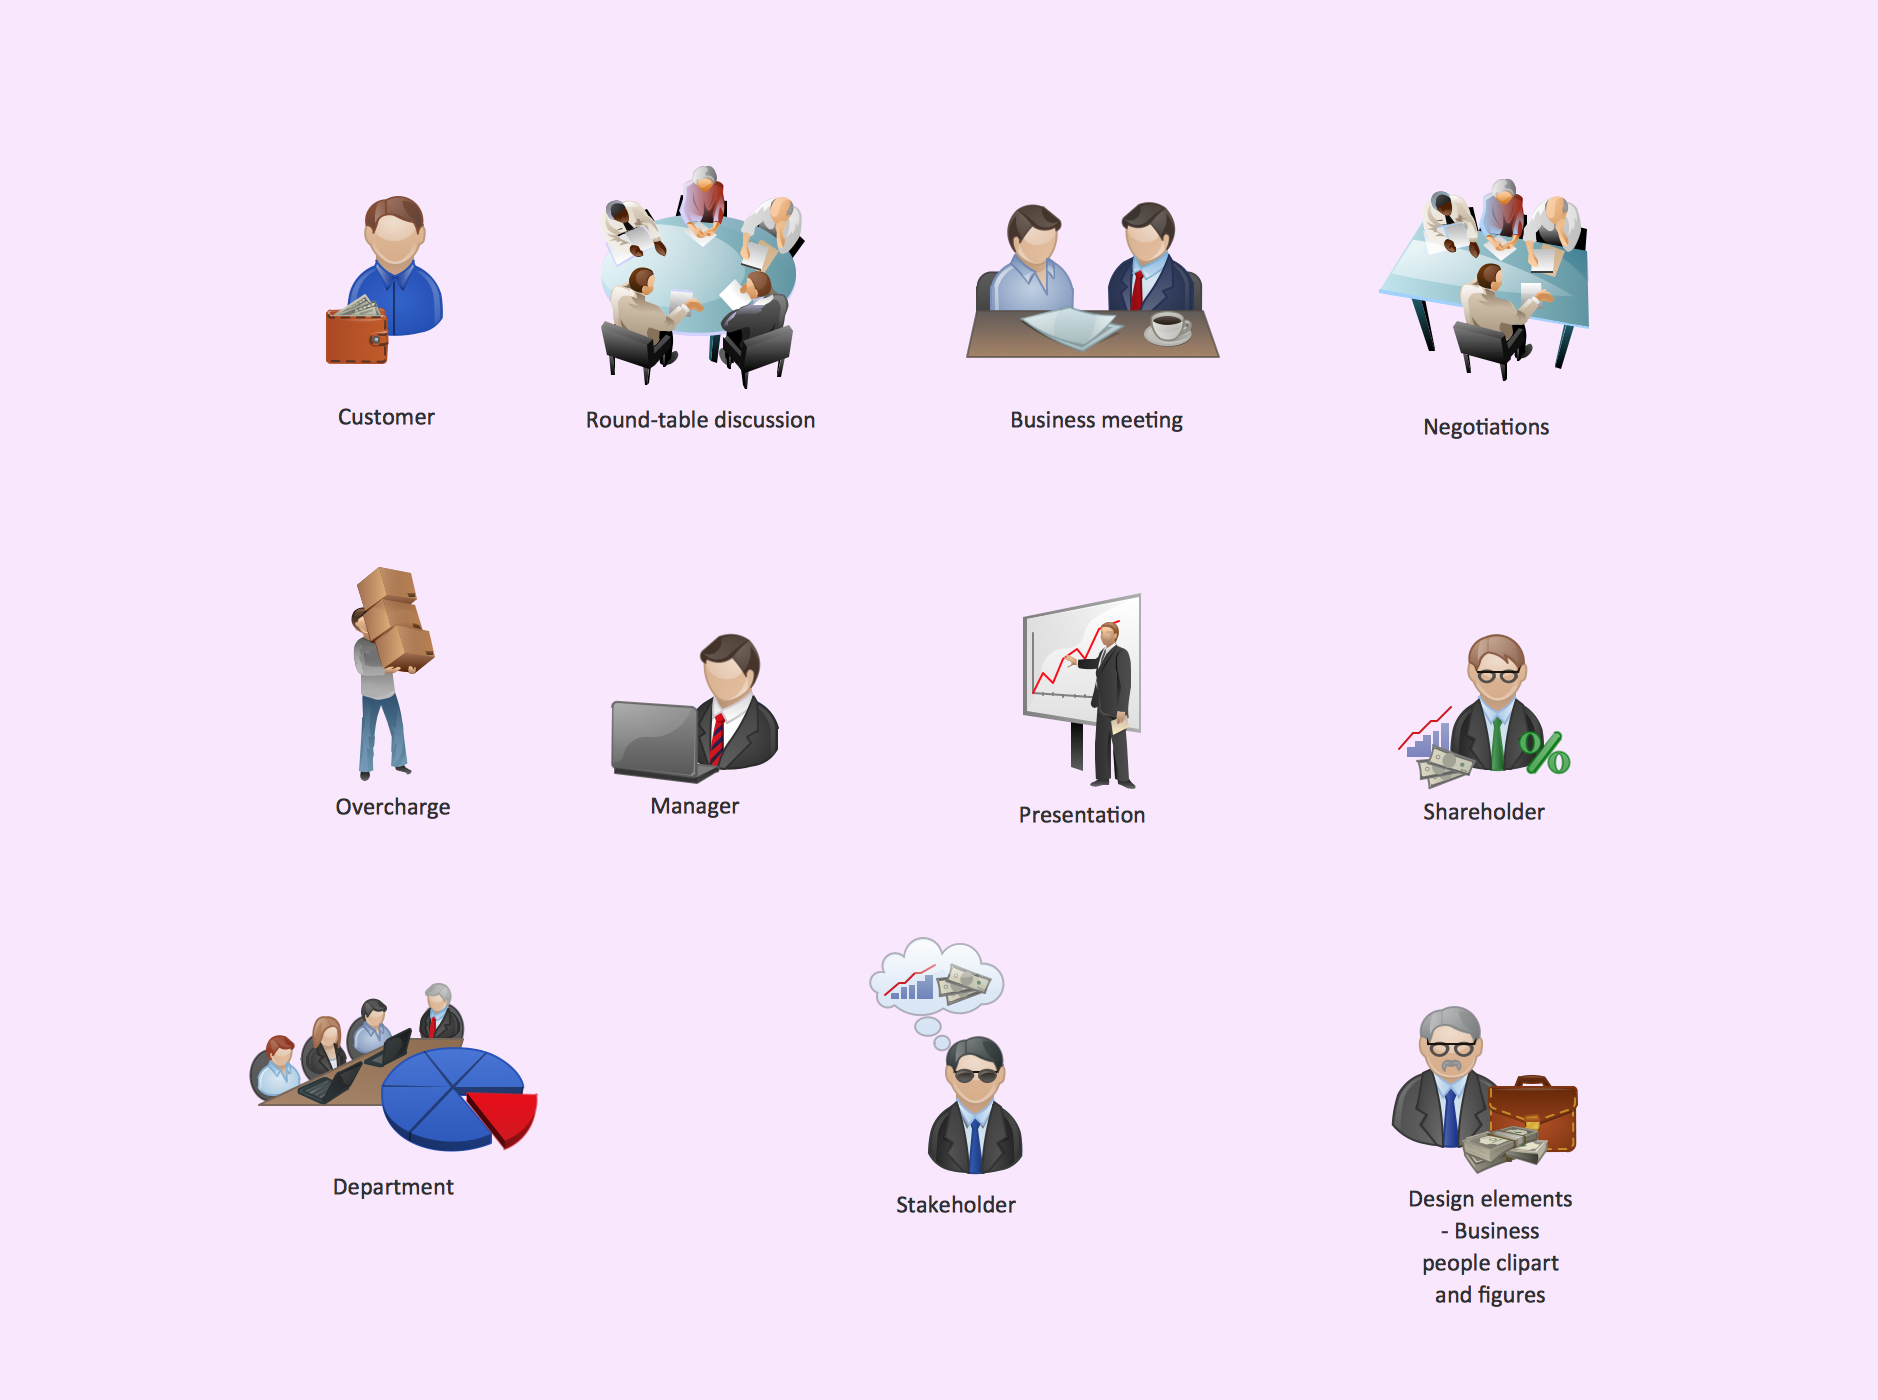
Business People Clipart
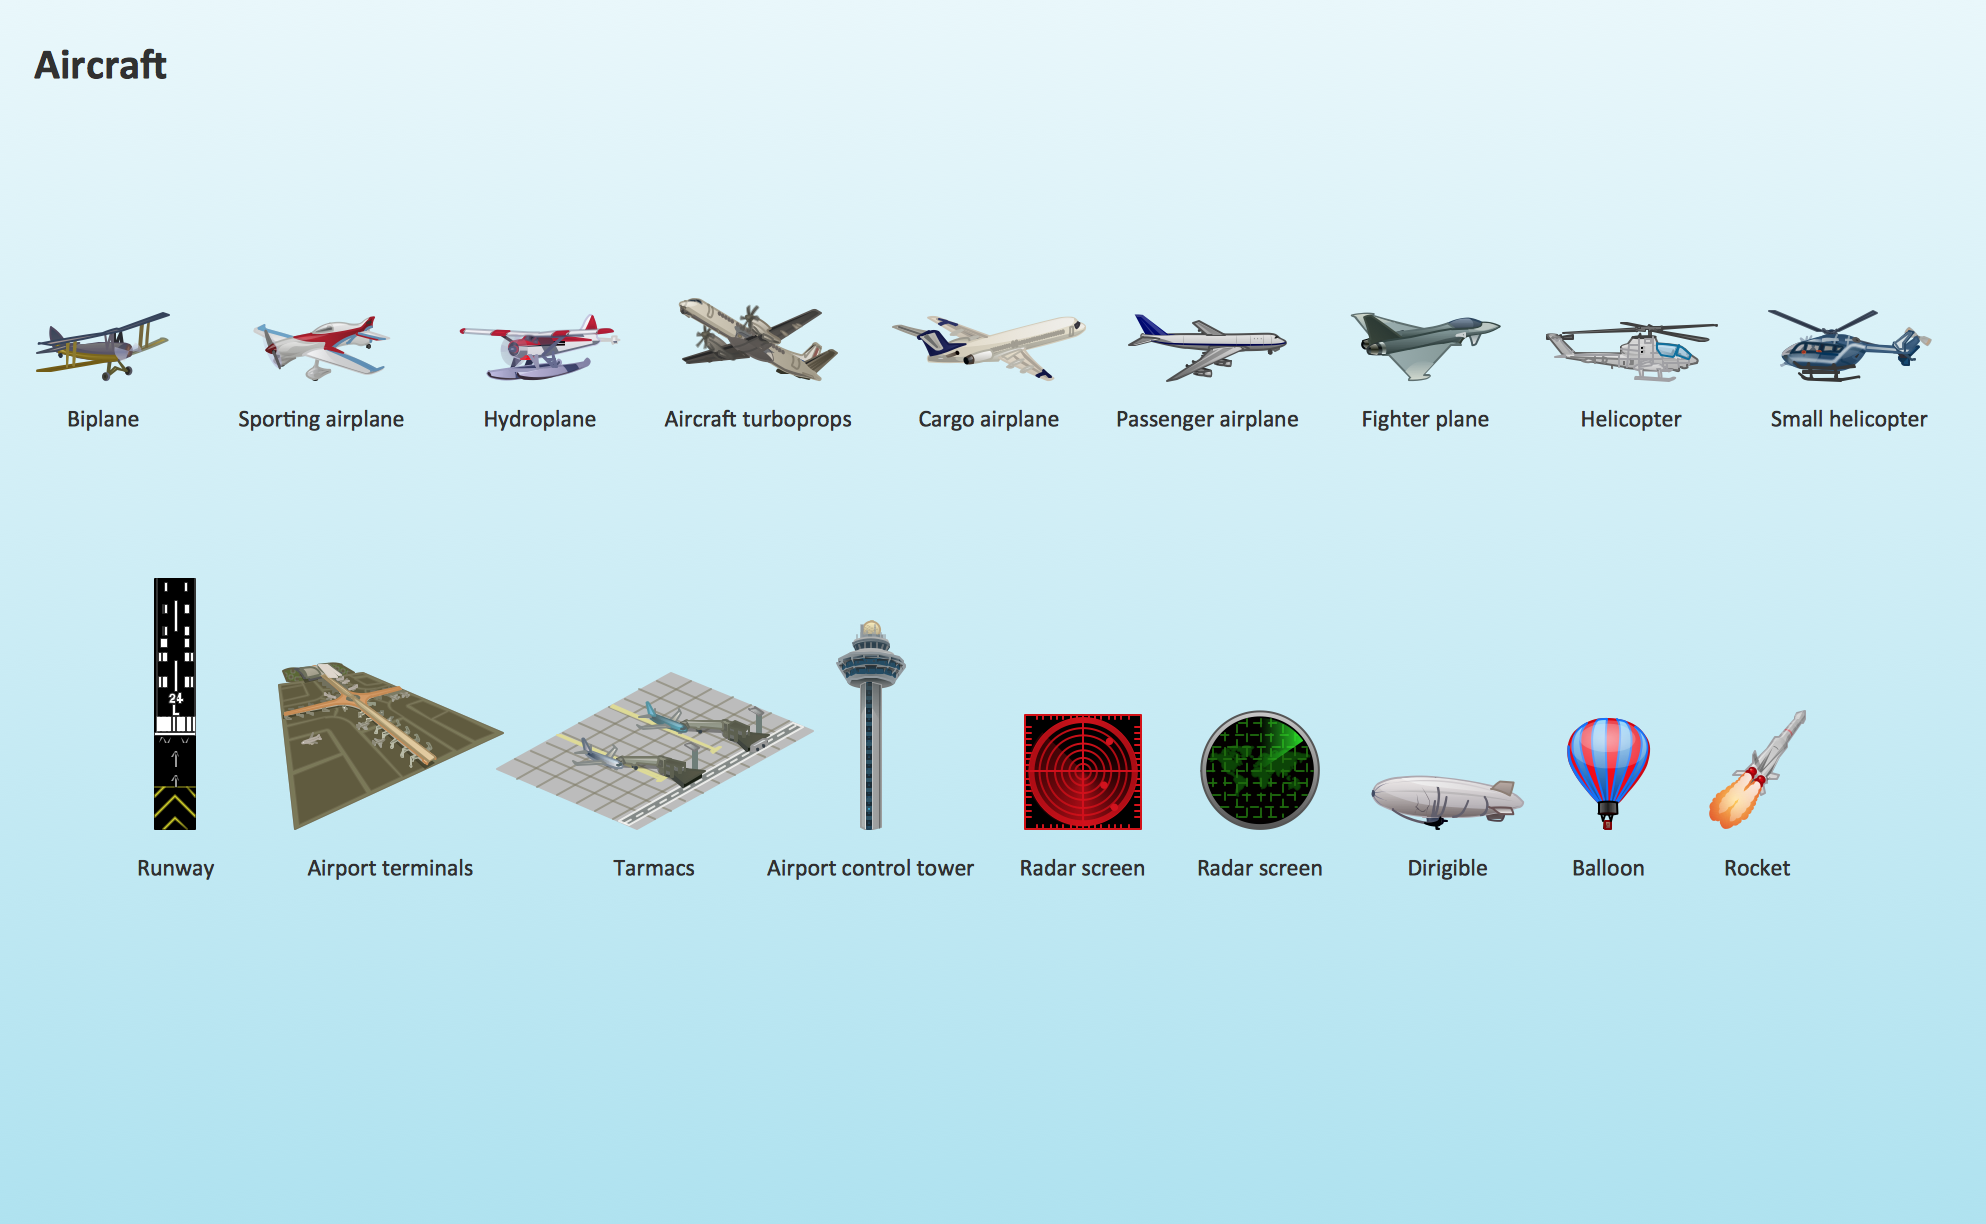
Aircraft - Design Elements
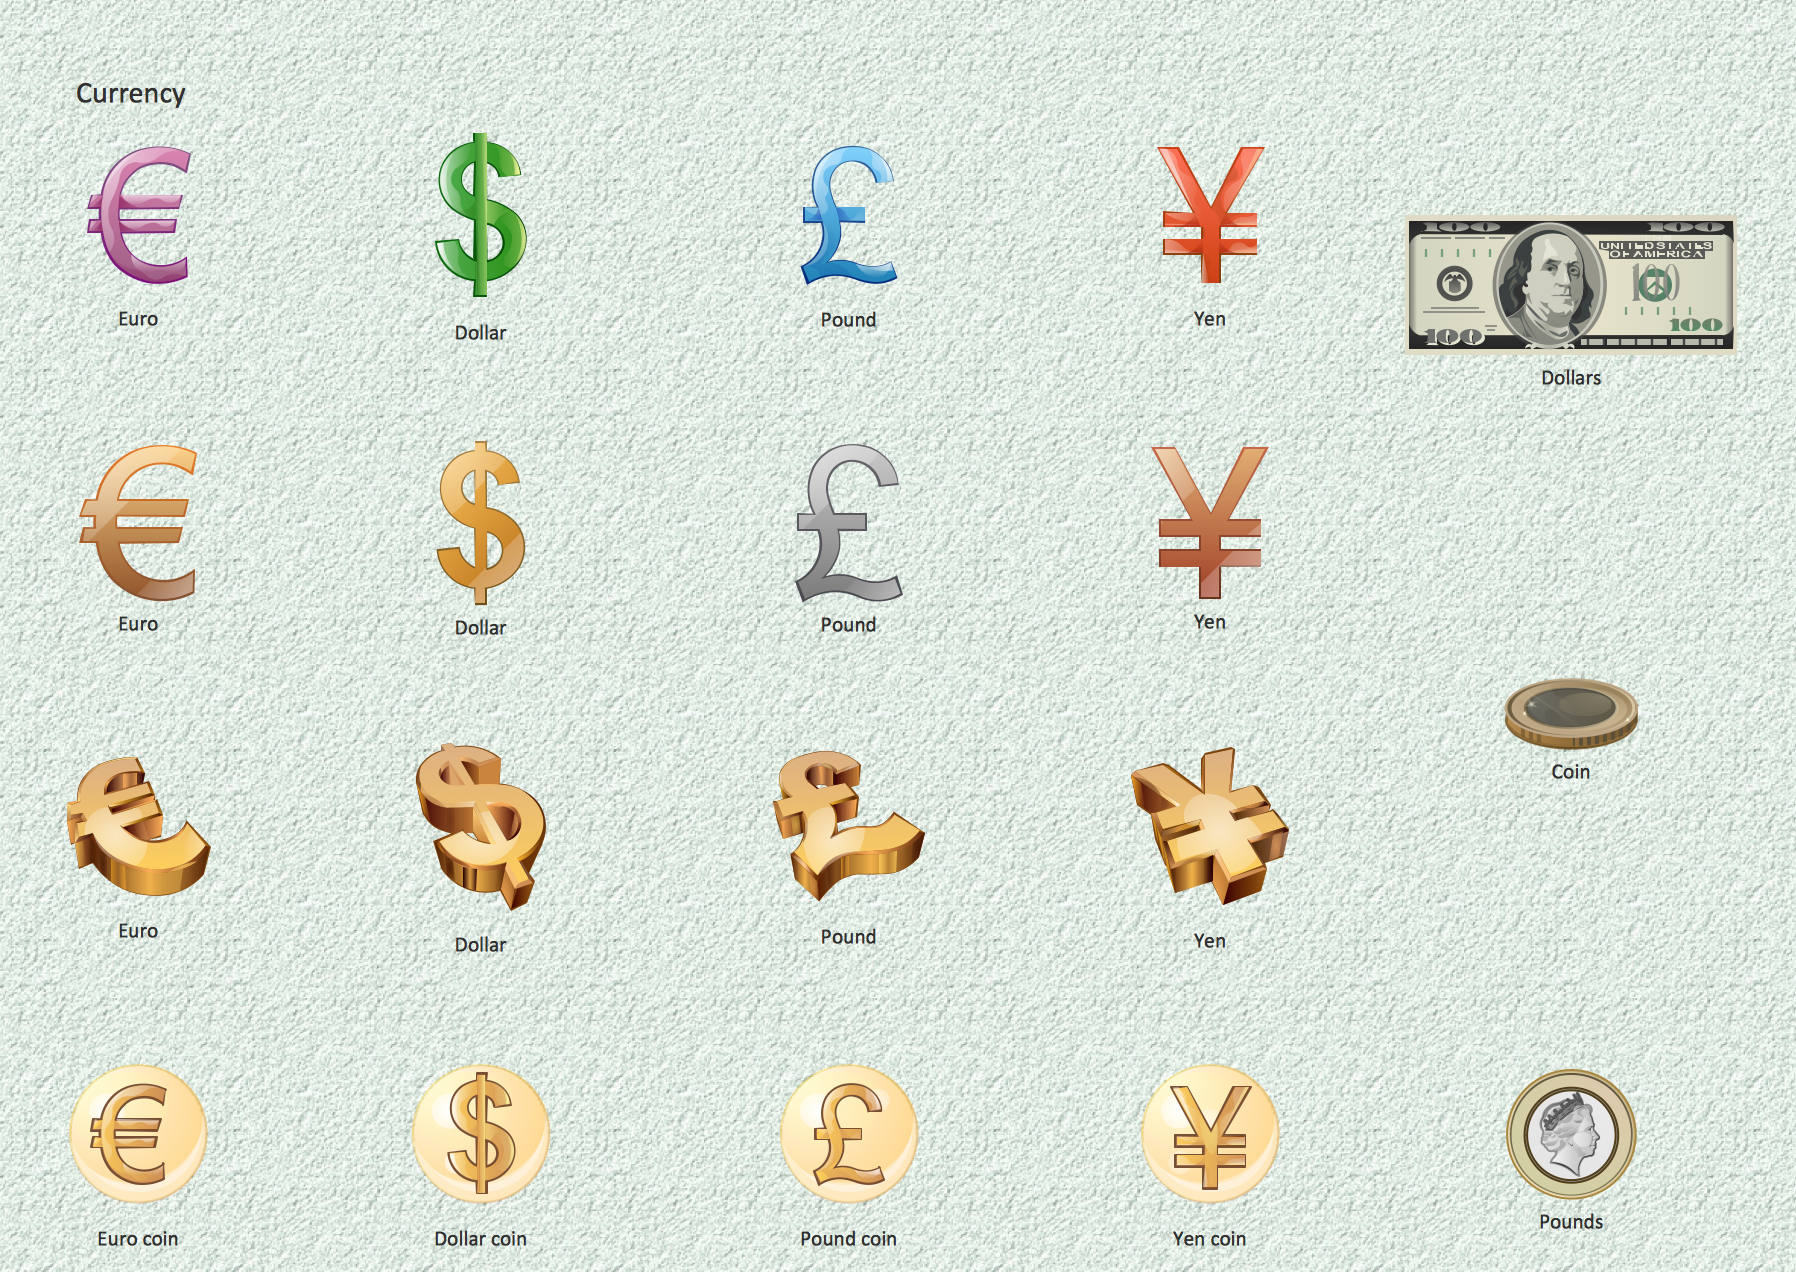
Currency - Design Elements
Star Network Topology


Design Pictorial Infographics. Design Infographics

 Business and Finance
Use Business and Finance solution to make professional-looking documents, presentations and websites, business, finance, advertising, and project management illustrations, or any designs that requires clipart of currency, office, business, advertising, management, marketing, people, time, post, contacts, collaboration, etc.
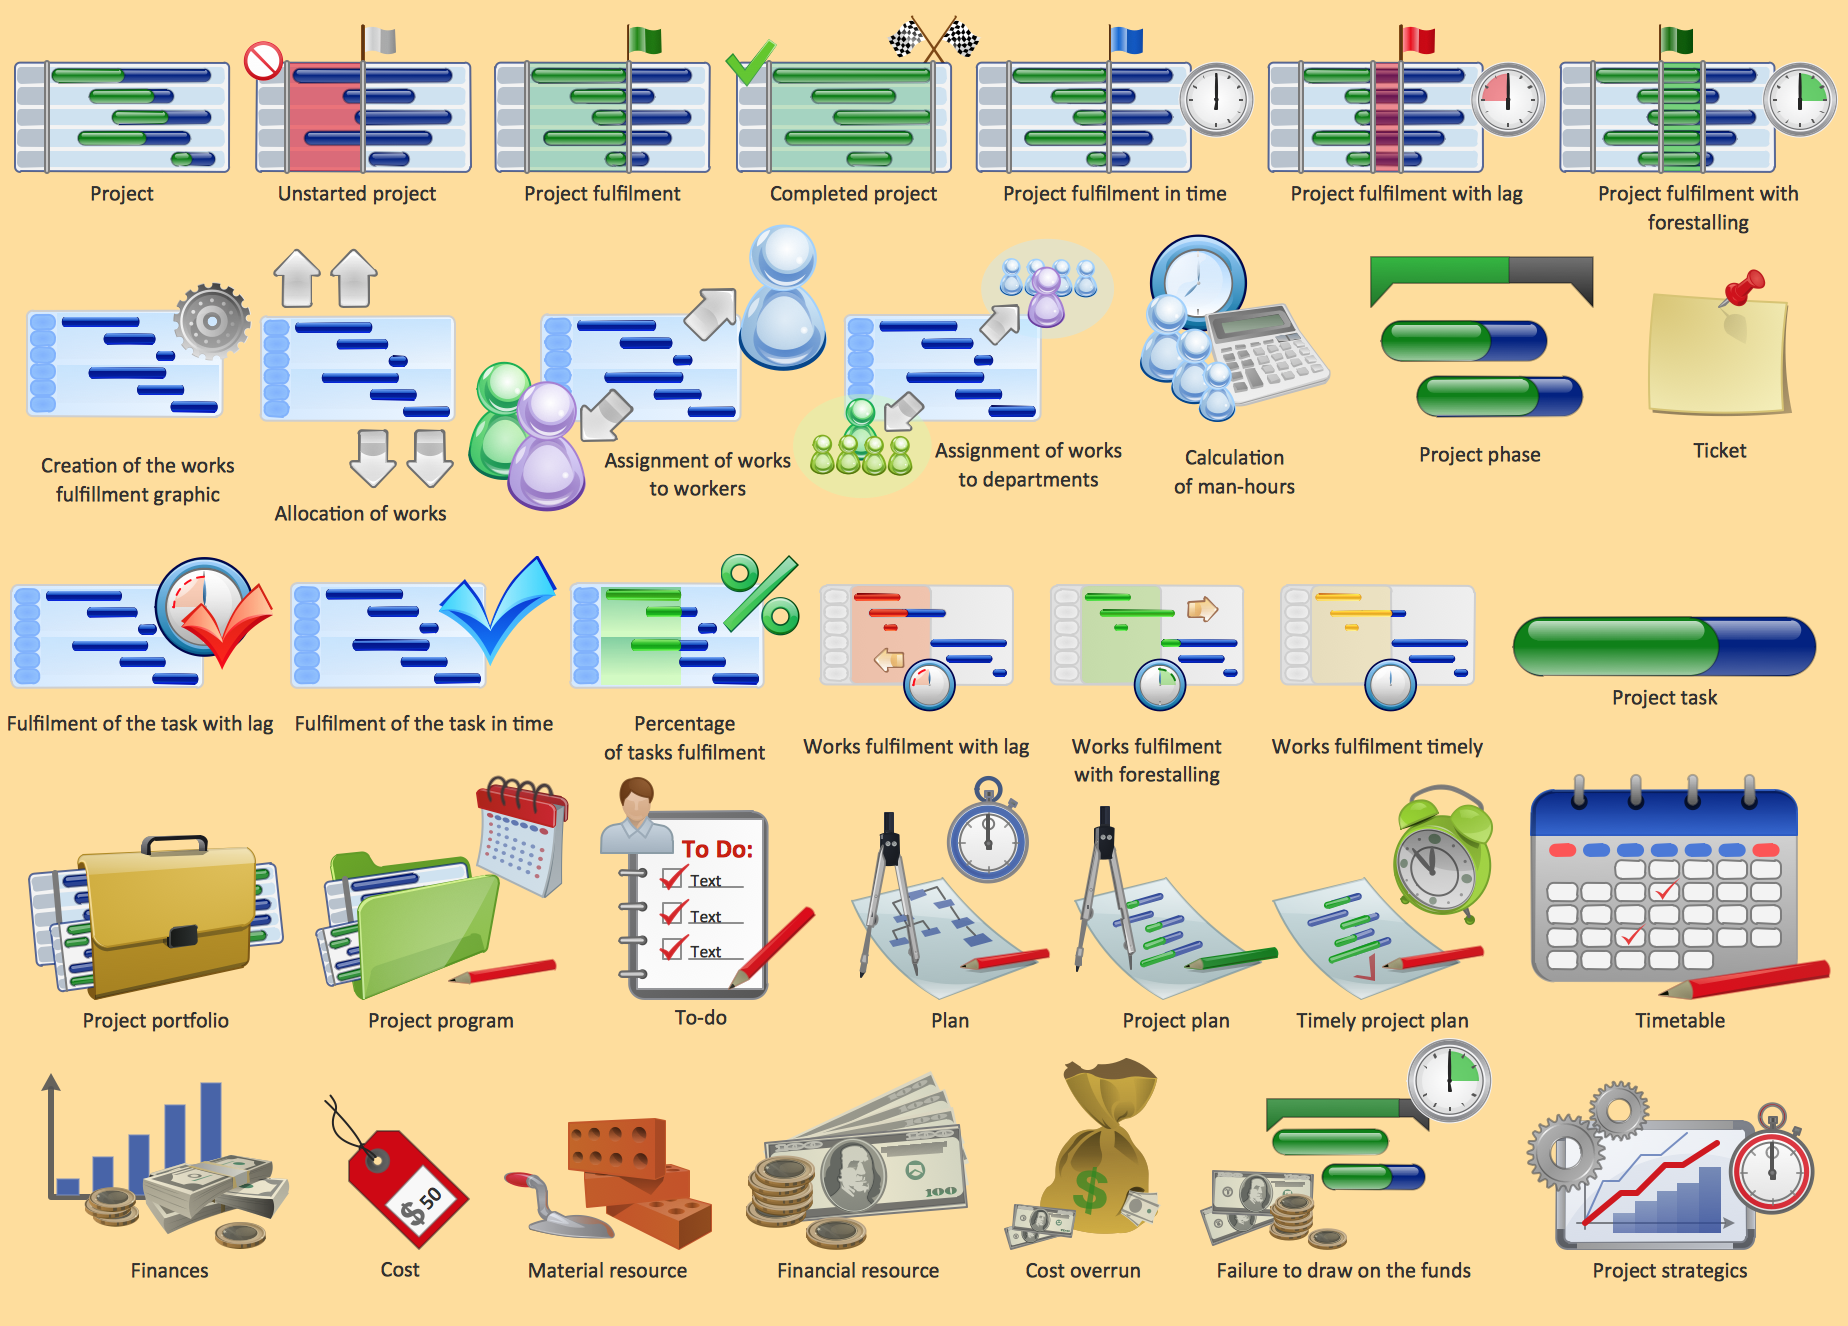
Project management - Design Elements
 Time Series Dashboard
Time series dashboard solution extends ConceptDraw DIAGRAM software with templates, samples and vector stencils libraries with charts, graphs and plots for drawing the visual dashboards showing data time series.
- Rest Clipart Png
- Time For Expansion Clip Art Png
- Business Clipart Png
- Softness Presentation | Presentation design elements - Vector clipart ...
- Clip Art Half Circle Hd Image Png
- Time Series Graph Png
- Time , quality, money triangle diagram | Shopping pictograms ...
- Active Directory Diagrams | Ads Image Png
- Time Symbols Png