Electrical Engineering
This solution extends ConceptDraw DIAGRAM.9.5 (or later) with electrical engineering samples, electrical schematic symbols, electrical diagram symbols, templates and libraries of design elements, to help you design electrical schematics, digital and analog
Circuits and Logic Diagram Software
ConceptDraw DIAGRAM provides Electrical Engineering solution from the Industrial Engineering Area of ConceptDraw Solution Park.Electrical Engineering solution helps you create quick and easy: Electrical schematics, Digital and analog logic designs, Circuit and wiring schematics and diagrams, Power systems diagrams, Maintenance and repair diagrams, Circuit board and amplifier diagrams, Integrated circuit schematics.
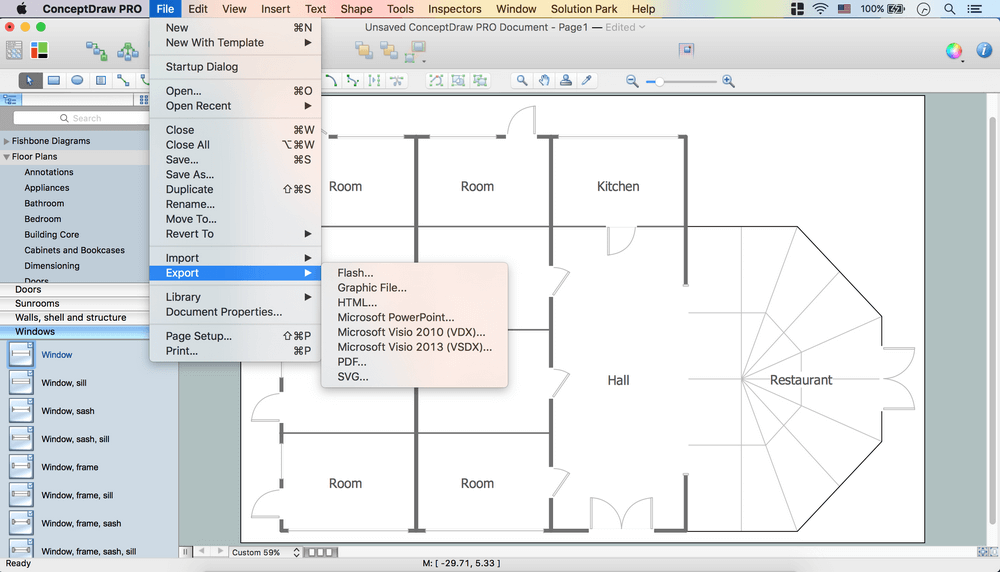
Create Floor Plans Easily with ConceptDraw DIAGRAM
There are two basic ways of creating a floor plan: hiring an interior designer or designing on one’s own. Professional help can be quite expensive, and the result may not always be worth the money. Let’s take a look at what skills are needed to create the interior design on your own.Primarily, this basic knowledge of the composition rules. It helps to compose, to place the shapes and volume of the interior, to achieve balance in the room between the free space and objects. This might help to compose correctly, to place the shapes and the volumes in the interior, to achieve balance between free space and furniture in the room.
Basic color theory. There are strictly defined rules and laws, which are used to select a fitting color combinations to create a harmonious interior.

Data Flow Diagram
Data flow diagram (DFD) is the part of the SSADM method (Structured Systems Analysis and Design Methodology), intended for analysis and information systems projection. Data flow diagrams are intended for graphical representation of data flows in the information system and for analysis of data processing during the structural projection. Data flow diagram often used in connection with human process and can be displayed as workflow diagram. The critical Process Flow Diagram is another flowchart technique for designing data flow in connection with organizational processes. The critical Process flow diagram may use different range of symbols than a classic workflow diagram.HelpDesk
How to Draw Physics Diagrams
Physics charts can be helpful when you learn Physics, perform experiments, or solve any other tasks regarding Physics. ConceptDraw DIAGRAM allows you to draw physical diagrams of mechanical, nuclear, optical and electrical processes using the set of vector physics symbols and physics diagram templates. Nothing is more helpful in the study of physics as a visual representation of the physical processes: physics schemes, diagrams, and illustrations.Audit Flowchart Symbols
Audit Flowchart helps you draw auditing diagrams for accounting, finance and money management, fiscal information tracking, decision making flow charts, financial inventories and documenting Six Sigma and ISO 9000 business processes.Audit Flowchart Symbols - It’s efficiently to use the colors creating the audit flowcharts to make them bright, visual, attractive and successful. The best flowchart maker use ConceptDraw DIAGRAM features of RapidDraw technique.
Fault Tree Diagram
ConceptDraw DIAGRAM diagramming and vector drawing software offers the Fault Tree Analysis Diagrams Solution from the Industrial Engineering Area of ConceptDraw Solution Park for quick and easy creating the Fault Tree Diagram of any degree of detailing.Influence Diagram
This sample shows the Influence Diagram. It was created in ConceptDraw DIAGRAM diagramming and vector drawing software using the Basic Diagramming Solution from the Universal Diagramming area of ConceptDraw Solution Park.Influence diagram represents the directed acyclic graph with three types of nodes and three types of arcs that connect the nodes. Decision node is drawn as a rectangle, Uncertainty node is drawn as an oval, Value node is drawn as an octagon.
Sales Flowcharts
The Sales Flowcharts solution lets you create and display sales process maps, sales process workflows, sales steps, the sales process, and anything else involving sales process management.
Types of Flowcharts
A Flowchart is a graphically representation of the process, algorithm or the step-by-step solution of the problem. There are ten types of Flowcharts. Using the Flowcharts solution from the Diagrams area of ConceptDraw Solution Park you can easy and quickly design the Flowchart of any of these types.
- How To use House Electrical Plan Software | Electrical Symbols ...
- Electromechanical Device Symbols
- How To use House Electrical Plan Software | Electrical Symbols ...
- Logic gate diagram - Template | Electrical Symbols — Logic Gate ...
- Electrical Symbols , Electrical Diagram Symbols | Design elements ...
- Wiring Diagrams with ConceptDraw PRO | Electrical Engineering ...
- Circuits and Logic Diagram Software | Electrical Symbols — Logic ...
- Electric Circuit Bar Graph
- Accounting Flowchart Symbols | Wiring Diagrams with ConceptDraw ...
- Home Electrical Plan | Electrical Symbols , Electrical Diagram ...
- ERD | Entity Relationship Diagrams, ERD Software for Mac and Win
- Flowchart | Basic Flowchart Symbols and Meaning
- Flowchart | Flowchart Design - Symbols, Shapes, Stencils and Icons
- Flowchart | Flow Chart Symbols
- Electrical | Electrical Drawing - Wiring and Circuits Schematics
- Flowchart | Common Flowchart Symbols