Types of Flowcharts


Mathematics Symbols

CAD Drawing Software for Making Mechanic Diagram and Electrical Diagram Architectural Designs


Flow chart Example. Warehouse Flowchart


 Website Wireframe
The innovative Website Wireframe solution enhances the ConceptDraw DIAGRAM functionality with newest wireframe tools, libraries with variety of predesigned icons, symbols, buttons, graphics, forms, boxes, and many other vector elements, templates and professionally designed samples, which make it the best wireframing software. Website Wireframe solution gives you significant advantages when designing and maintaining websites, creating skeletal and content-free depictions of website structure, making website prototypes and planning the content arrangement before committing to design, also speeds up the processes of sketching, producing and sharing wireframe examples of website style and interface design.
 Plumbing and Piping Plans
Plumbing and Piping Plans solution extends ConceptDraw DIAGRAM.2.2 software with samples, templates and libraries of pipes, plumbing, and valves design elements for developing of water and plumbing systems, and for drawing Plumbing plan, Piping plan, PVC Pipe plan, PVC Pipe furniture plan, Plumbing layout plan, Plumbing floor plan, Half pipe plans, Pipe bender plans.
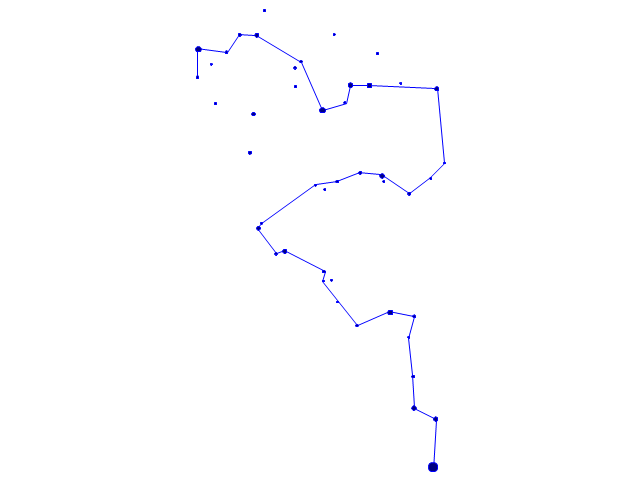
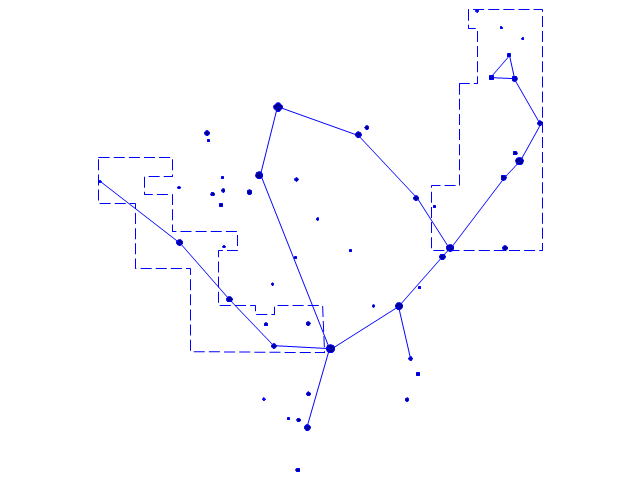
The vector stencils library "Constellations except Zodiac, Northern and Southern" contains 47 star constellation maps of all constellations except Zodiac, Northern (45-90 degrees) and Southern (45-90 degrees).
Use these shapes for drawing astronomical diagrams and illustrations in ConceptDraw PRO diagramming and vector drawing software extended with the Astronomy solution from the Science and Education area in ConceptDraw Solution Park.
Use these shapes for drawing astronomical diagrams and illustrations in ConceptDraw PRO diagramming and vector drawing software extended with the Astronomy solution from the Science and Education area in ConceptDraw Solution Park.
Andromeda

Antlia

Aquila

Auriga

Bootes

Caelum

Canes Venatici

Canis Major

Canis Minor

Centaurus

Cetus

Columba

Coma Berenices

Corona Australis

Corona Borealis

Corvus

Crater

Cygnus

Delphinus

Equuleus

Eridanus
Fornax

Grus

Hercules

Hydra

Lacerta

Leo Minor

Lepus

Lupus

Lynx

Lyra

Microscopium

Monoceros

Ophiuchus and Serpens
Orion

Pegasus

Perseus

Piscis Austrinus

Puppis

Pyxis

Sagitta

Sculptor

Scutum

Sextans

Triangulum

Vela

Vulpecula

Design Pictorial Infographics. Design Infographics

 Landscape & Garden
The Landscape and Gardens solution for ConceptDraw DIAGRAM is the ideal drawing tool when creating landscape plans. Any gardener wondering how to design a garden can find the most effective way with Landscape and Gardens solution.
- Solar System Diagram Sketches
- Solar System Drawing Image
- Solar System Sketch Diagram
- Er Diagram Of Solar System Hd Images
- Solar System Image In Sketch
- Solar system planets
- Drawing Figure Of Solar System
- Solar System Symbols | Sun Solar System | Sketching Software ...
- Solar System Planets Sketch
- Solar System Drawing Pics