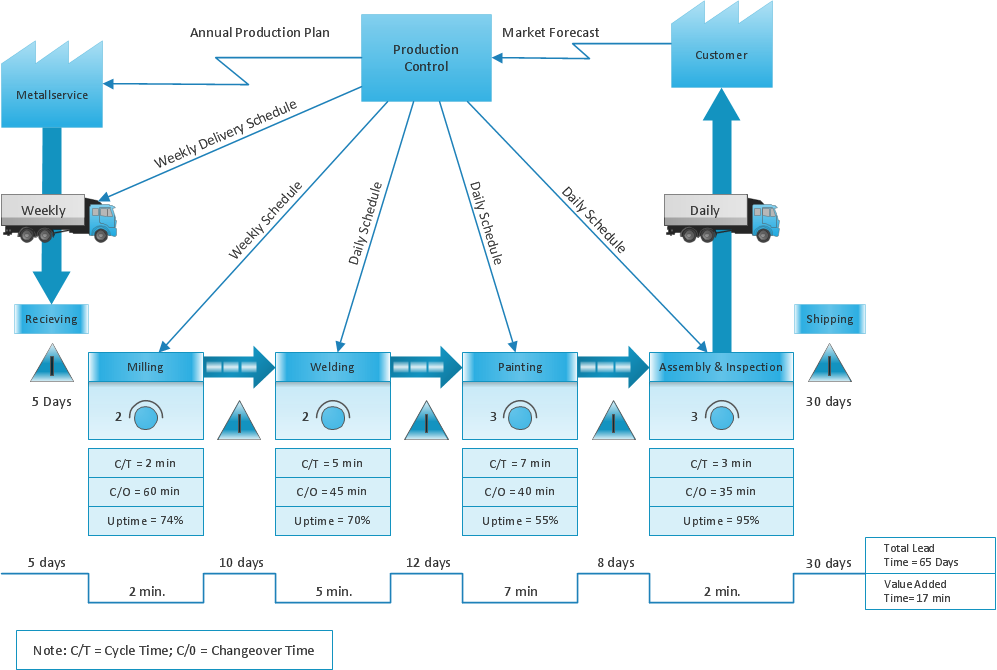
This site uses cookies. By continuing to browse the ConceptDraw site you are agreeing to our Use of Site Cookies.
HelpDesk

How to Add and Edit Connector Text

ConceptDraw DIAGRAM gives you some tools for connecting shapes: Direct Connectors, Smart, Arc, Bezier, Curve and Round Connectors. Direct Connectors are direct lines from the point to the point. Smart, Arc, Bezier, Curve and Round Connectors are almost the same as Direct Connectors. However, they automatically move around other objects. You can use Chain, or Tree connection mode for connection of multiple objects with any type of connectors. ConceptDraw DIAGRAM allows you to add and move text on a connector the same way that you add and move text on other any object.

ConceptDraw Arrows10 Technology

You can use text with any conceptDraw connectors to describe relationships between objects.

Add text to connectors the same way you add text to any object - doubleclick a connector and type.
HelpDesk

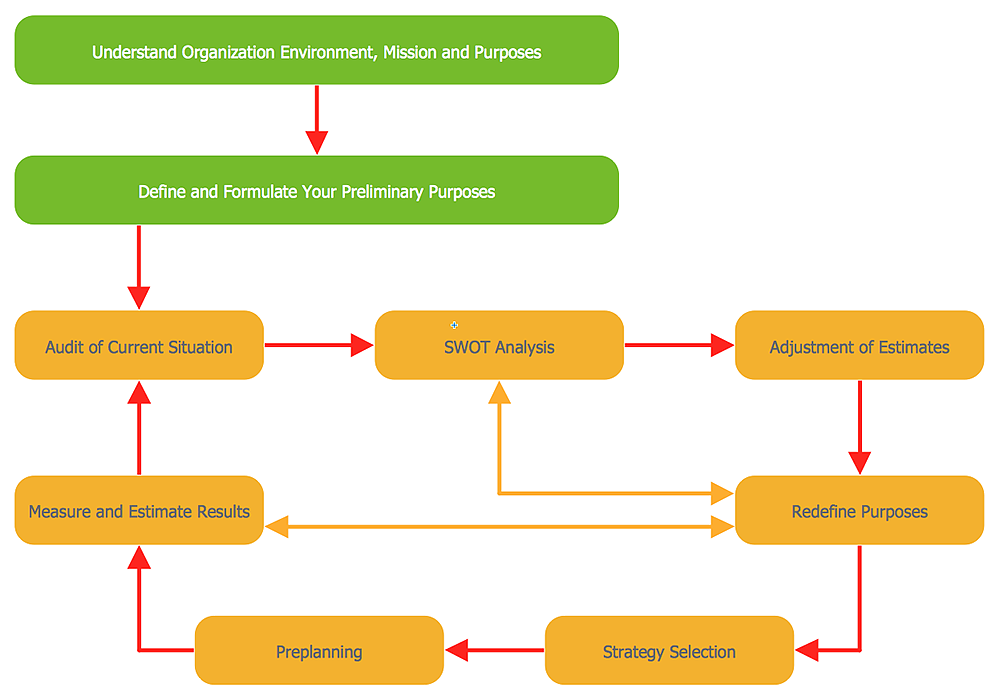
How to Create a Concept Map

The graphical technique of knowledge representation in the form of structured networks of concepts (ideas) is called concept mapping. Concept network consists of shapes that represent concepts and connectors representing relationships between concepts. The difference between mind maps and concept maps is that a mind map has only one object depicting the main idea, while a concept map may have several. Concept mapping is used to structure ideas, to communicate a complex system of knowledge, to help the learning process, etc. ConceptDraw DIAGRAM allows you to draw concept maps using the Concept Map solution.
HelpDesk

How to Create a Bubble Diagram

Bubble Diagram is a simple chart that consists of circles (bubbles) repesening certain topics or processes. Bubbles are connected by lines depicting the type of relationships between the bubbles. The size of each bubble is depended on the importance of the entity it represents. Bubble charts are widely used throughout social, economical, medical, and other scientific researches as well as throughout architecture and business management. Bubble charts are often used during the early stages of product development to visualize thoughts and ideas for the purpose of sketching out a development plan. ConceptDraw DIAGRAM allows you to draw a bubble diagrams using the Bubble Diagrams solution.

ConceptDraw Arrows10 Technology

ConceptDraw Arrows10 Technology - This is more than enough versatility to draw any type of diagram with any degree of complexity.
HelpDesk

How to Create Computers and Communications Infographics

Design professional, good-looking infographics, presentations and schematics related to computers and communications. ConceptDraw DIAGRAM and its Computers and Communications solution supply your artworks with a huge number of vector clipart of electronic devices, computers, and symbols of electronic communication technologies. Finally, you can effortlessly convert your artworks into PowerPoint presentation, Adobe PDF file, HTML, or any graphics formats.
HelpDesk

How to Create an SDL Diagram

Specification and Description Language (SDL) is intended to describe systems that switched state often and rapidly. An SDL diagram is a view of a system, that can depict a single process or complex relationships between a number of elements. The SDL diagram supports a nested hierarchy. A system is divided into blocks, each of them can be described as a process until finally, one can see the initial procedures that make up each process. The advantage of this method is that a system can be viewed in a manageable part that can be followed separately. ConceptDraw Specification and Description Language solution contains the library, with an SDL notation in a vector stencil graphics. The SDL solution also provides a set of samples, to show the level of hierarchical detail that is possible.
HelpDesk

How to Make Network Diagram

ConceptDraw DIAGRAM allows you to represent and communicate network architecture, topology, and design to engineers, stakeholders, and end-users.
HelpDesk

How to Start Drawing a Diagram on Mac
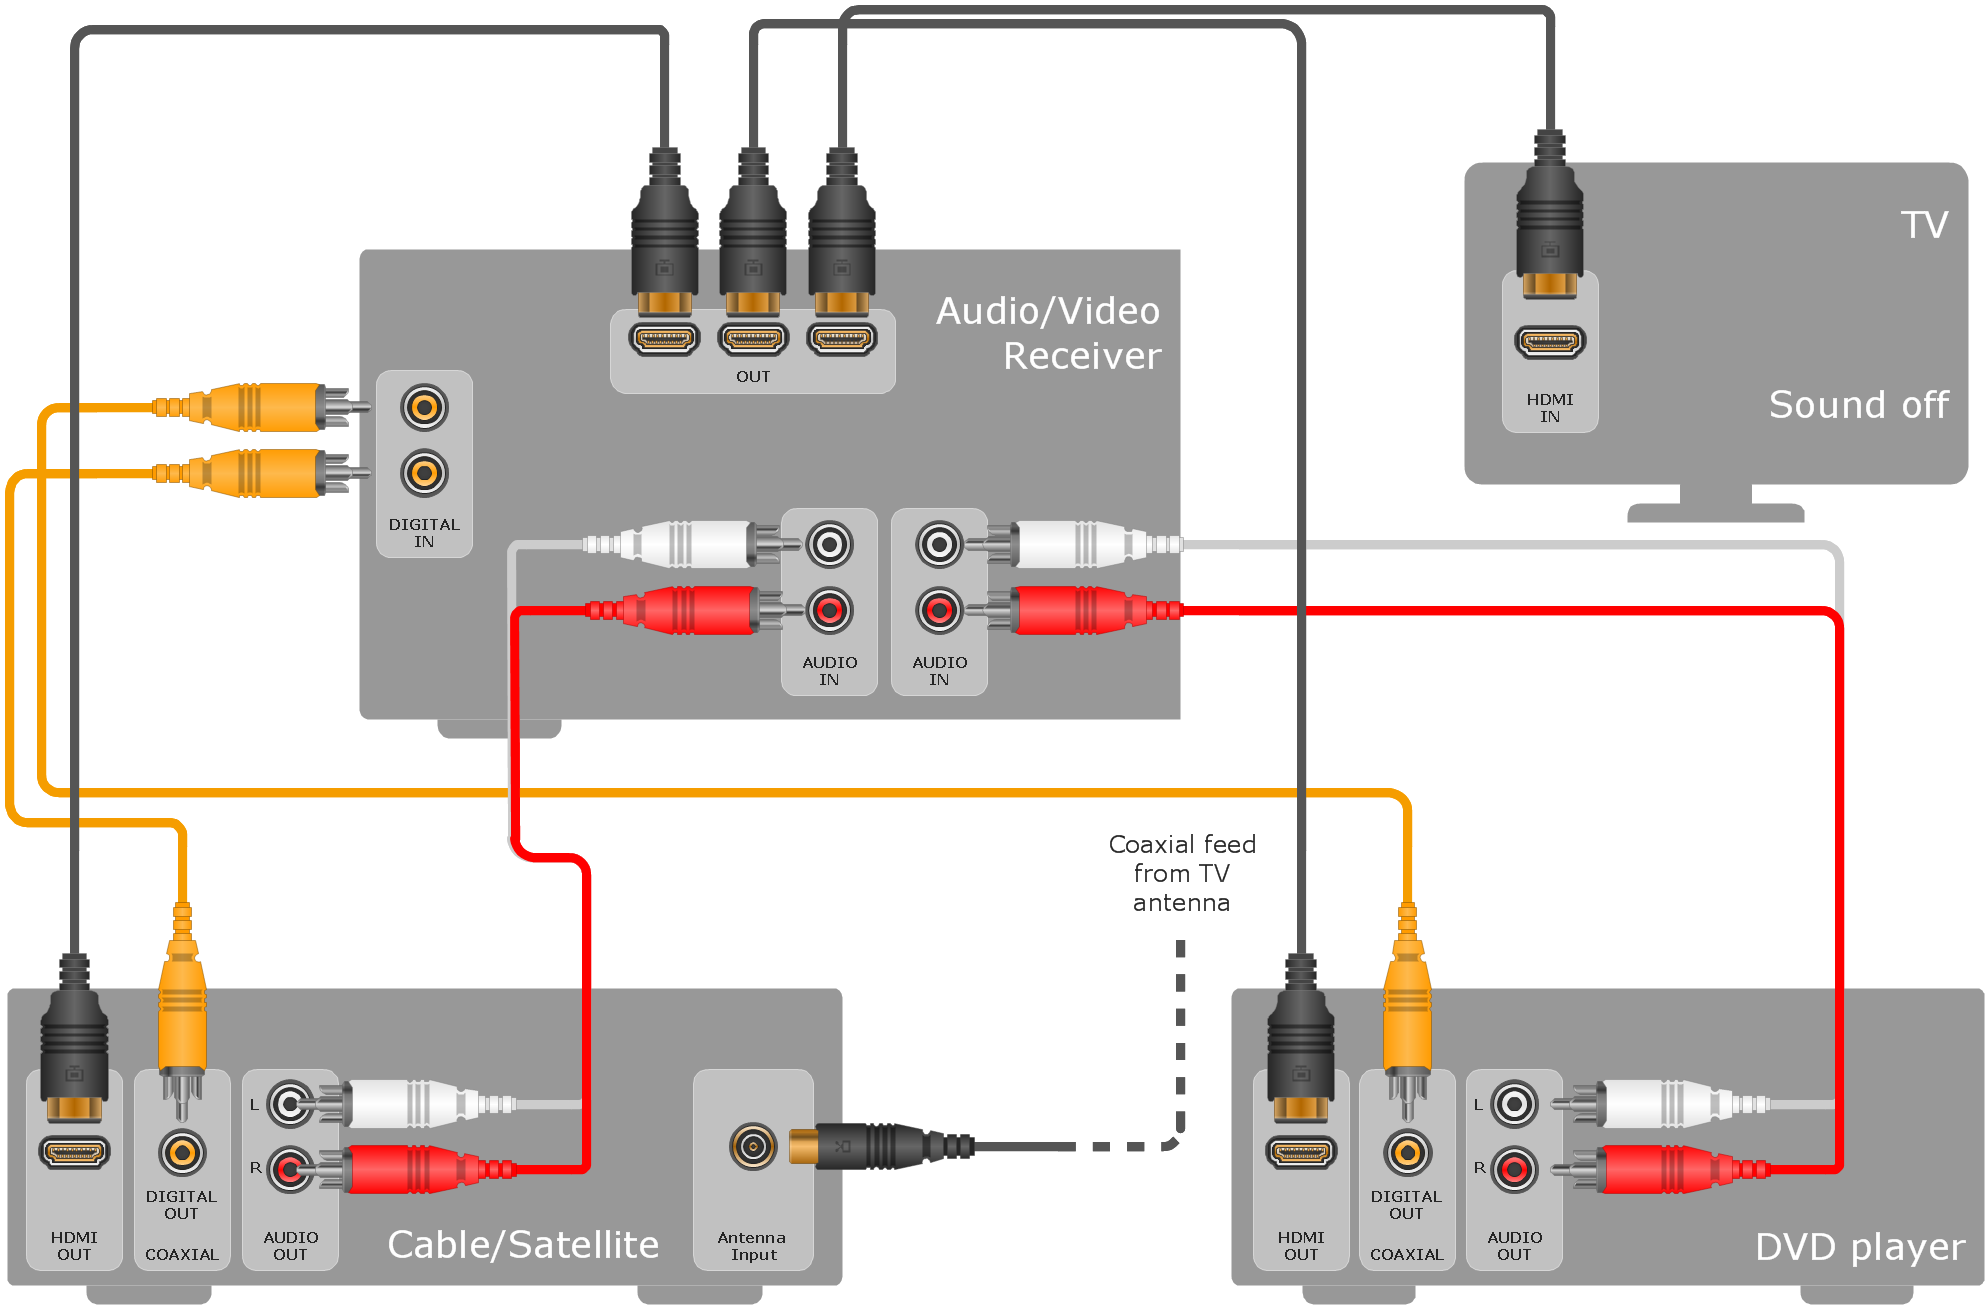
There are many types of diagrams, you can create using ConceptDraw DIAGRAM: network diagrams, organizational charts, flowcharts, workflow diagrams, technical schemes, and building plans. However, there are the same basic steps to start creating almost all of them. Here the tutorial we will show how to create a simple chart using a template, and how to add shapes to your drawing using libraries.
In this tutorial, we will explain how to create a simple chart in ConceptDraw DIAGRAM using a template, and how to use the library objects.