 Interactive Voice Response Diagrams
Interactive Voice Response Diagrams solution extends ConceptDraw DIAGRAM software with samples, templates and libraries of ready-to-use vector stencils that help create Interactive Voice Response (IVR) diagrams illustrating in details a work of interactive voice response system, the IVR system’s logical and physical structure, Voice-over-Internet Protocol (VoIP) diagrams, and Action VoIP diagrams with representing voice actions on them, to visualize how the computers interact with callers through voice recognition and dual-tone multi-frequency signaling (DTMF) keypad inputs.
Interactive voice response (IVR) networks. Computer and Network Examples
 networks. <br>Computer and Network Examples *")

IVR Systems

Metropolitan area networks (MAN). Computer and Network Examples
. Computer and Network Examples")
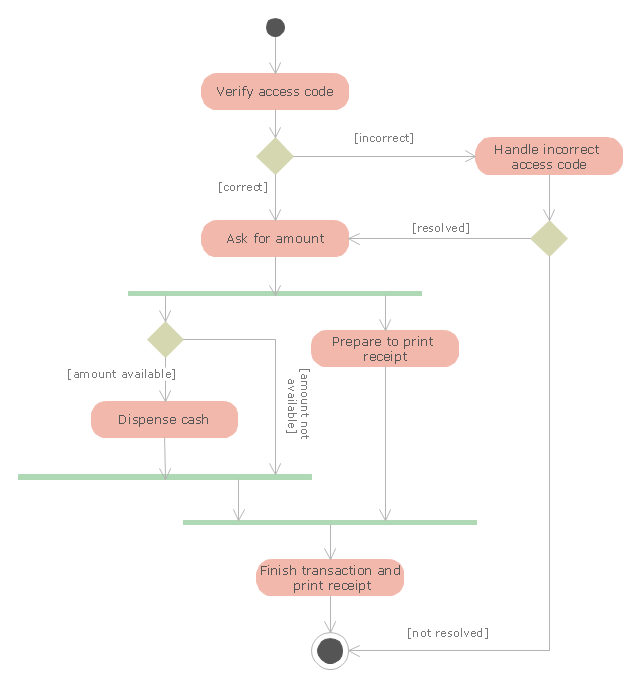
"An automated teller machine or automatic teller machine" (ATM) (American, Australian, Singaporean, Indian, and Hiberno-English), also known as an automated banking machine (ABM) (Canadian English), cash machine, cashpoint, cashline or hole in the wall (British, South African, and Sri Lankan English), is an electronic telecommunications device that enables the clients of a financial institution to perform financial transactions without the need for a cashier, human clerk or bank teller.
On most modern ATMs, the customer is identified by inserting a plastic ATM card with a magnetic stripe or a plastic smart card with a chip that contains a unique card number and some security information such as an expiration date or CVVC (CVV). Authentication is provided by the customer entering a personal identification number (PIN). The newest ATM at Royal Bank of Scotland allows customers to withdraw cash up to £100 without a card by inputting a six-digit code requested through their smartphones.
Using an ATM, customers can access their bank accounts in order to make cash withdrawals, get debit card cash advances, and check their account balances as well as purchase pre-paid mobile phone credit. If the currency being withdrawn from the ATM is different from that which the bank account is denominated in (e.g.: Withdrawing Japanese yen from a bank account containing US dollars), the money will be converted at an official wholesale exchange rate. Thus, ATMs often provide one of the best possible official exchange rates for foreign travellers, and are also widely used for this purpose." [Automated teller machine. Wikipedia]
The UML activity diagram example "Cash withdrawal from ATM" was created using the ConceptDraw PRO diagramming and vector drawing software extended with the Rapid UML solution from the Software Development area of ConceptDraw Solution Park.
UML activity diagram
UML Tool & UML Diagram Examples

The vector stencils library "Bank UML deployment diagram" contains 10 shapes for drawing UML deployment diagrams.
Use it for object-oriented modeling of your bank information system.
"A deployment diagram in the Unified Modeling Language models the physical deployment of artifacts on nodes. To describe a web site, for example, a deployment diagram would show what hardware components ("nodes") exist (e.g., a web server, an application server, and a database server), what software components ("artifacts") run on each node (e.g., web application, database), and how the different pieces are connected (e.g. JDBC, REST, RMI).
The nodes appear as boxes, and the artifacts allocated to each node appear as rectangles within the boxes. Nodes may have subnodes, which appear as nested boxes. A single node in a deployment diagram may conceptually represent multiple physical nodes, such as a cluster of database servers.
There are two types of Nodes:
1. Device Node.
2. Execution Environment Node.
Device nodes are physical computing resources with processing memory and services to execute software, such as typical computers or mobile phones. An execution environment node (EEN) is a software computing resource that runs within an outer node and which itself provides a service to host and execute other executable software elements." [Deployment diagram. Wikipedia]
This example of UML deployment diagram symbols for the ConceptDraw PRO diagramming and vector drawing software is included in the ATM UML Diagrams solution from the Software Development area of ConceptDraw Solution Park.
UML deployment diagram symbols

 Rapid UML
Rapid UML solution extends ConceptDraw DIAGRAM software with templates, samples and libraries of vector stencils for quick drawing the UML diagrams using Rapid Draw technology.
Software Diagram Examples and Templates

Entity Relationship Software

 Directional Maps
Directional Maps solution extends ConceptDraw DIAGRAM software with templates, samples and libraries of vector stencils for drawing the directional, location, site, transit, road and route maps, plans and schemes.
- UML use case diagram - Banking system | How to Create a Bank ...
- UML use case diagram - Banking system | IVR services | Interactive ...
- UML use case diagram - Banking system | UML for Bank | Interactive ...
- Interactive voice response (IVR) networks. Computer and Network ...
- UML use case diagram - Banking system | Interactive Voice ...
- UML use case diagram - Banking system | Data structure diagram ...
- Bank Sequence Diagram | UML use case diagram - Banking system ...
- UML use case diagram - Banking system
- Bank System | Banking System | Class UML Diagram for Bank ...
- Telephone Operator Flow Chart
- UML use case diagram - Banking system
- Bank Transaction System Use Case Diagram
- ATM UML Diagrams | Bank Sequence Diagram | UML Use Case ...
- UML use case diagram - Banking system | UML Deployment ...
- UML use case diagram - Banking system | Bank Sequence Diagram ...
- UML use case diagram - Banking system | Data Flow Diagrams ...
- UML use case diagram - Banking system | ATM UML Diagrams ...
- Use Case Diagram For Online Banking System
- UML use case diagram - Banking system | Rapid UML | Rapid UML ...
- UML use case diagram - Banking system | UML activity diagram ...