 Active Directory Diagrams
Active Directory Diagrams solution significantly extends the capabilities of ConceptDraw DIAGRAM software with special Active Directory samples, convenient template and libraries of Active Directory vector stencils, common icons of sites and services, icons of LDPA elements, which were developed to help you in planning and modelling network structures and network topologies, in designing excellently looking Active Directory diagrams, Active Directory Structure diagrams, and Active Directory Services diagram, which are perfect way to visualize detailed structures of Microsoft Windows networks, Active Directory Domain topology, Active Directory Site topology, Organizational Units (OU), and Exchange Server organization.
Active Directory Diagram

Project —Task Trees and Dependencies

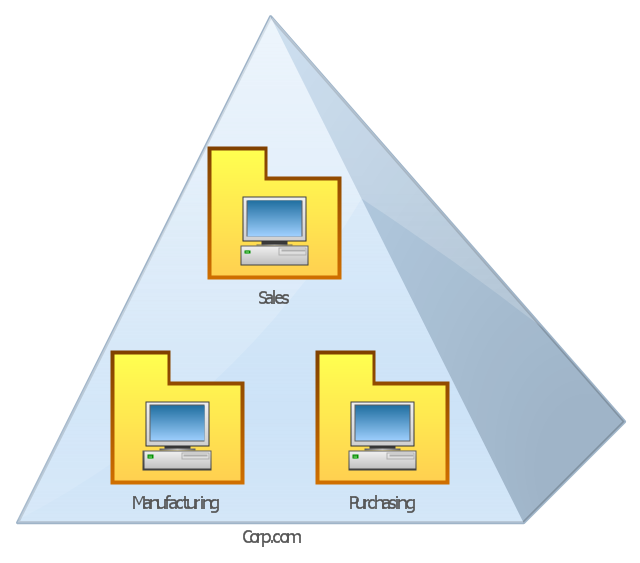
This AD diagram example was redesigned from the picture "Single root domain with a structured OU model" from the book "Active Directory for Dummies".
"A domain is the cornerstone that you lay whenever you create trees and forests. Regardless of whether you design a tree or a forest, the starting point is always the root domain. The root domain is the first domain that you create in your AD structure, and it sits at the top of your diagram.
The root domain of your tree, similar to any other domain, is a grouping of
resources built on the following components:
(1) Domain controllers.
(2) Security policies. ...
For many small and medium-sized companies, a single root domain with a
structured OU (organizational unit) model... provides sufficient flexibility for an AD tree. ...
However, larger companies, companies with complex organization charts, and
companies with multiple sites often find that a single domain isn’t suitable." [Steve Clines and Marcia Loughry, Active Directory® For Dummies®, 2nd Edition. 2008]
The Active Directory diagram example "Single root domain with a structured OU model" was created using the ConceptDraw PRO diagramming and vector drawing software extended with the Active Directory Diagrams solution from the Computer and Networks area of ConceptDraw Solution Park.
Active Directory network diagram
Root Cause Tree Diagram

The FTA diagram sample "Fault tree analysis - Insulin delivery system" was redesigned from the illustration of "CMSI 641: Introduction to Software Engineering. Design of Critical Systems. B.J. Johnson. 2005. Loyola Marymount University".
"Another way of assessing hazards is using fault tree analysis. In this process, each of the identified hazards is covered by a detailed analysis to find out what might cause it. Either inductive or deductive reasoning is applied. In the case of software hazards, the usual focus is to determine faults that will cause the system to fail to deliver a system service, such as a monitoring system. A "fault tree" is constructed to link all the possible situations together, to help identify the interrelationships of the failures, which modules may cause them, and what "trickle-down effects" there might be. Here is an example of a fault tree, as applied to the Insulin delivery system from Sommerville...
Note that this tree is only partially complete, since only the potential software faults are shown on the diagram. The potential failures involving hardware, such as low battery, blood monitor or sensor failure, patient over-exertion or inattention, or medical staff failure are noticeable by their absence.
The fault tree and safety specification processes are two ways of helping with system risk assessment tasks. Once the risks are identified, there are other assessments that need to take place. First, the likelihood of the risk occurrance must be assessed. This is often quantifiable, so numbers may be assigned based on things like MTBF, latency effects, and other known entities. There may be other non-quantifiable contributors to the risk likelihood, however, such that these must be assessed and estimated by experts in the domain. (Don't short-change this process when dealing with critical systems!) Finally, the risk assessment must include the severity of the risk, meaning an estimation of the cost to the project in the event the risk item actually does occur. "Cost to the project" means all associated costs, including schedule delays, human injury, damage to hardware, corruption of data, and so on."
[myweb.lmu.edu/ bjohnson/ cmsi641web/ week15-2.html]
The FTA diagram example "Fault tree analysis - Insulin delivery system" was created using the ConceptDraw PRO diagramming and vector drawing software extended with the Fault Tree Analysis Diagrams solution from the Engineering area of ConceptDraw Solution Park.
FTA diagram

HelpDesk
How to Create an Active Directory Diagram

How to Draw an Organization Chart

MS Visio Look a Like Diagrams

Active Directory
- Tree and Forest (Full Trust) - Active Directory network diagram ...
- Active Directory Domain Services | Network Diagram Examples ...
- Diagram Of Typical Domain Setup
- Tree and Forest (Full Trust) - Active Directory network diagram ...
- Active Directory Domain Services diagram | Active Directory ...
- Single root domain with a structured OU model | Design Element ...
- Active Directory Diagram | Active Directory Diagrams | Tree and ...
- Six Markets Model Chart | Basic Flowchart Examples | Marketing ...
- What Is Tree Network Topology And Our Diagram
- Active Directory Domain Services | Active Directory Diagrams ...