The pipe laying and setting the plumbing system at new apartment or home, or replacing the worn plumbing begins from the choice of materials, sizes of pipes and creation the plan. When developing a piping system, the engineer should take into account many aspects, such as advantages and disadvantages of different pipes materials, the temperature changes (freezing or thermal expansion) that effect on pipes. The most commonly used are steel pipes which have passed the test of time, but they are difficult for assembling and prone to corrosion, plastic (polypropylene) pipes that are characterized by low weight and price, ease of installation and durability, and also PEX-AL-PEX pipes.
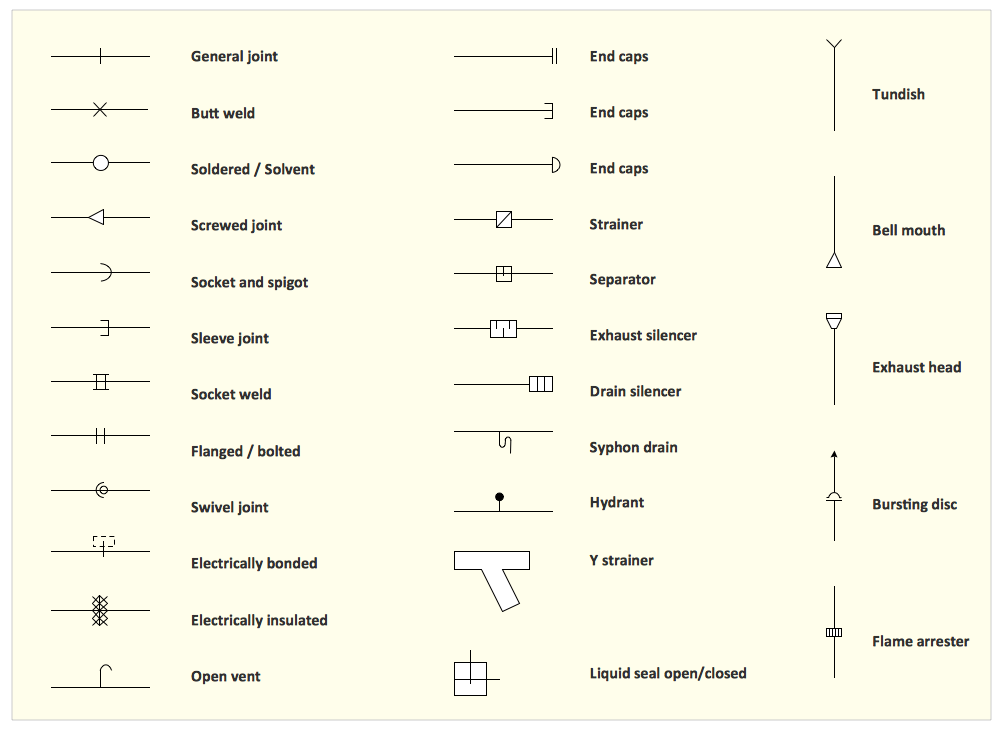
Numerous libraries with ready-to-use design elements of pipes, valves and other plumbing and piping equipment included to Plumbing and Piping Plans solution for ConceptDraw DIAGRAM help easy design Piping and Plumbing interior design plans, blueprints, schematic diagrams, technical drawings of waste water disposal systems, hot and cold water supply systems.


