This site uses cookies. By continuing to browse the ConceptDraw site you are agreeing to our Use of Site Cookies.

Basic Flowchart Symbols and Meaning

Flowchart Symbols and Meaning - Provides a visual representation of basic flowchart symbols and their proposed use in professional workflow diagram, standard process flow diagram and communicating the structure of a well-developed web site, as well as their correlation in developing on-line instructional projects. See flowchart's symbols by specifics of process flow diagram symbols and workflow diagram symbols.
How to Build a Flowchart

Business Process Flowchart Symbols

The business process flowchart symbols used for business process mapping are predefined by Business Process Modeling Notation (BPMN) and actually have their roots in the data processing diagrams and programming flow charts. Business Process flowchart symbols provide drawing business process flowcharts, diagrams and maps of any complexity.
HelpDesk

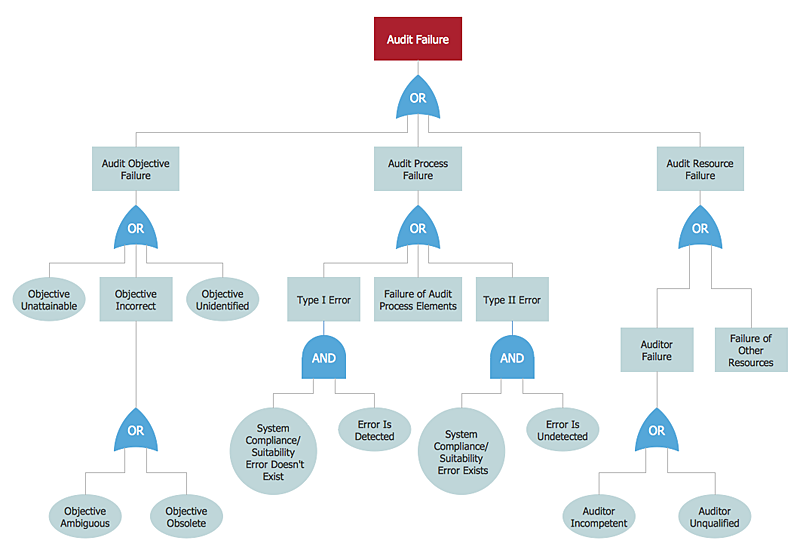
How to Create a Fault Tree Analysis Diagram (FTD)

Fault Tree Diagram is a logic diagram that shows the state of an entire system in a relationship of the conditions of its elements. Fault Tree Diagram is used to analyze the probability of functional system failures and safety accidents. ConceptDraw DIAGRAM allows you to create professional Fault Tree Diagrams using the basic FTD symbols. An FTD visualizes a model of the processes within a system that can lead to the unlikely event. A fault tree diagrams are created using standard logic symbols. The basic elements in a fault tree diagram are gates and events.

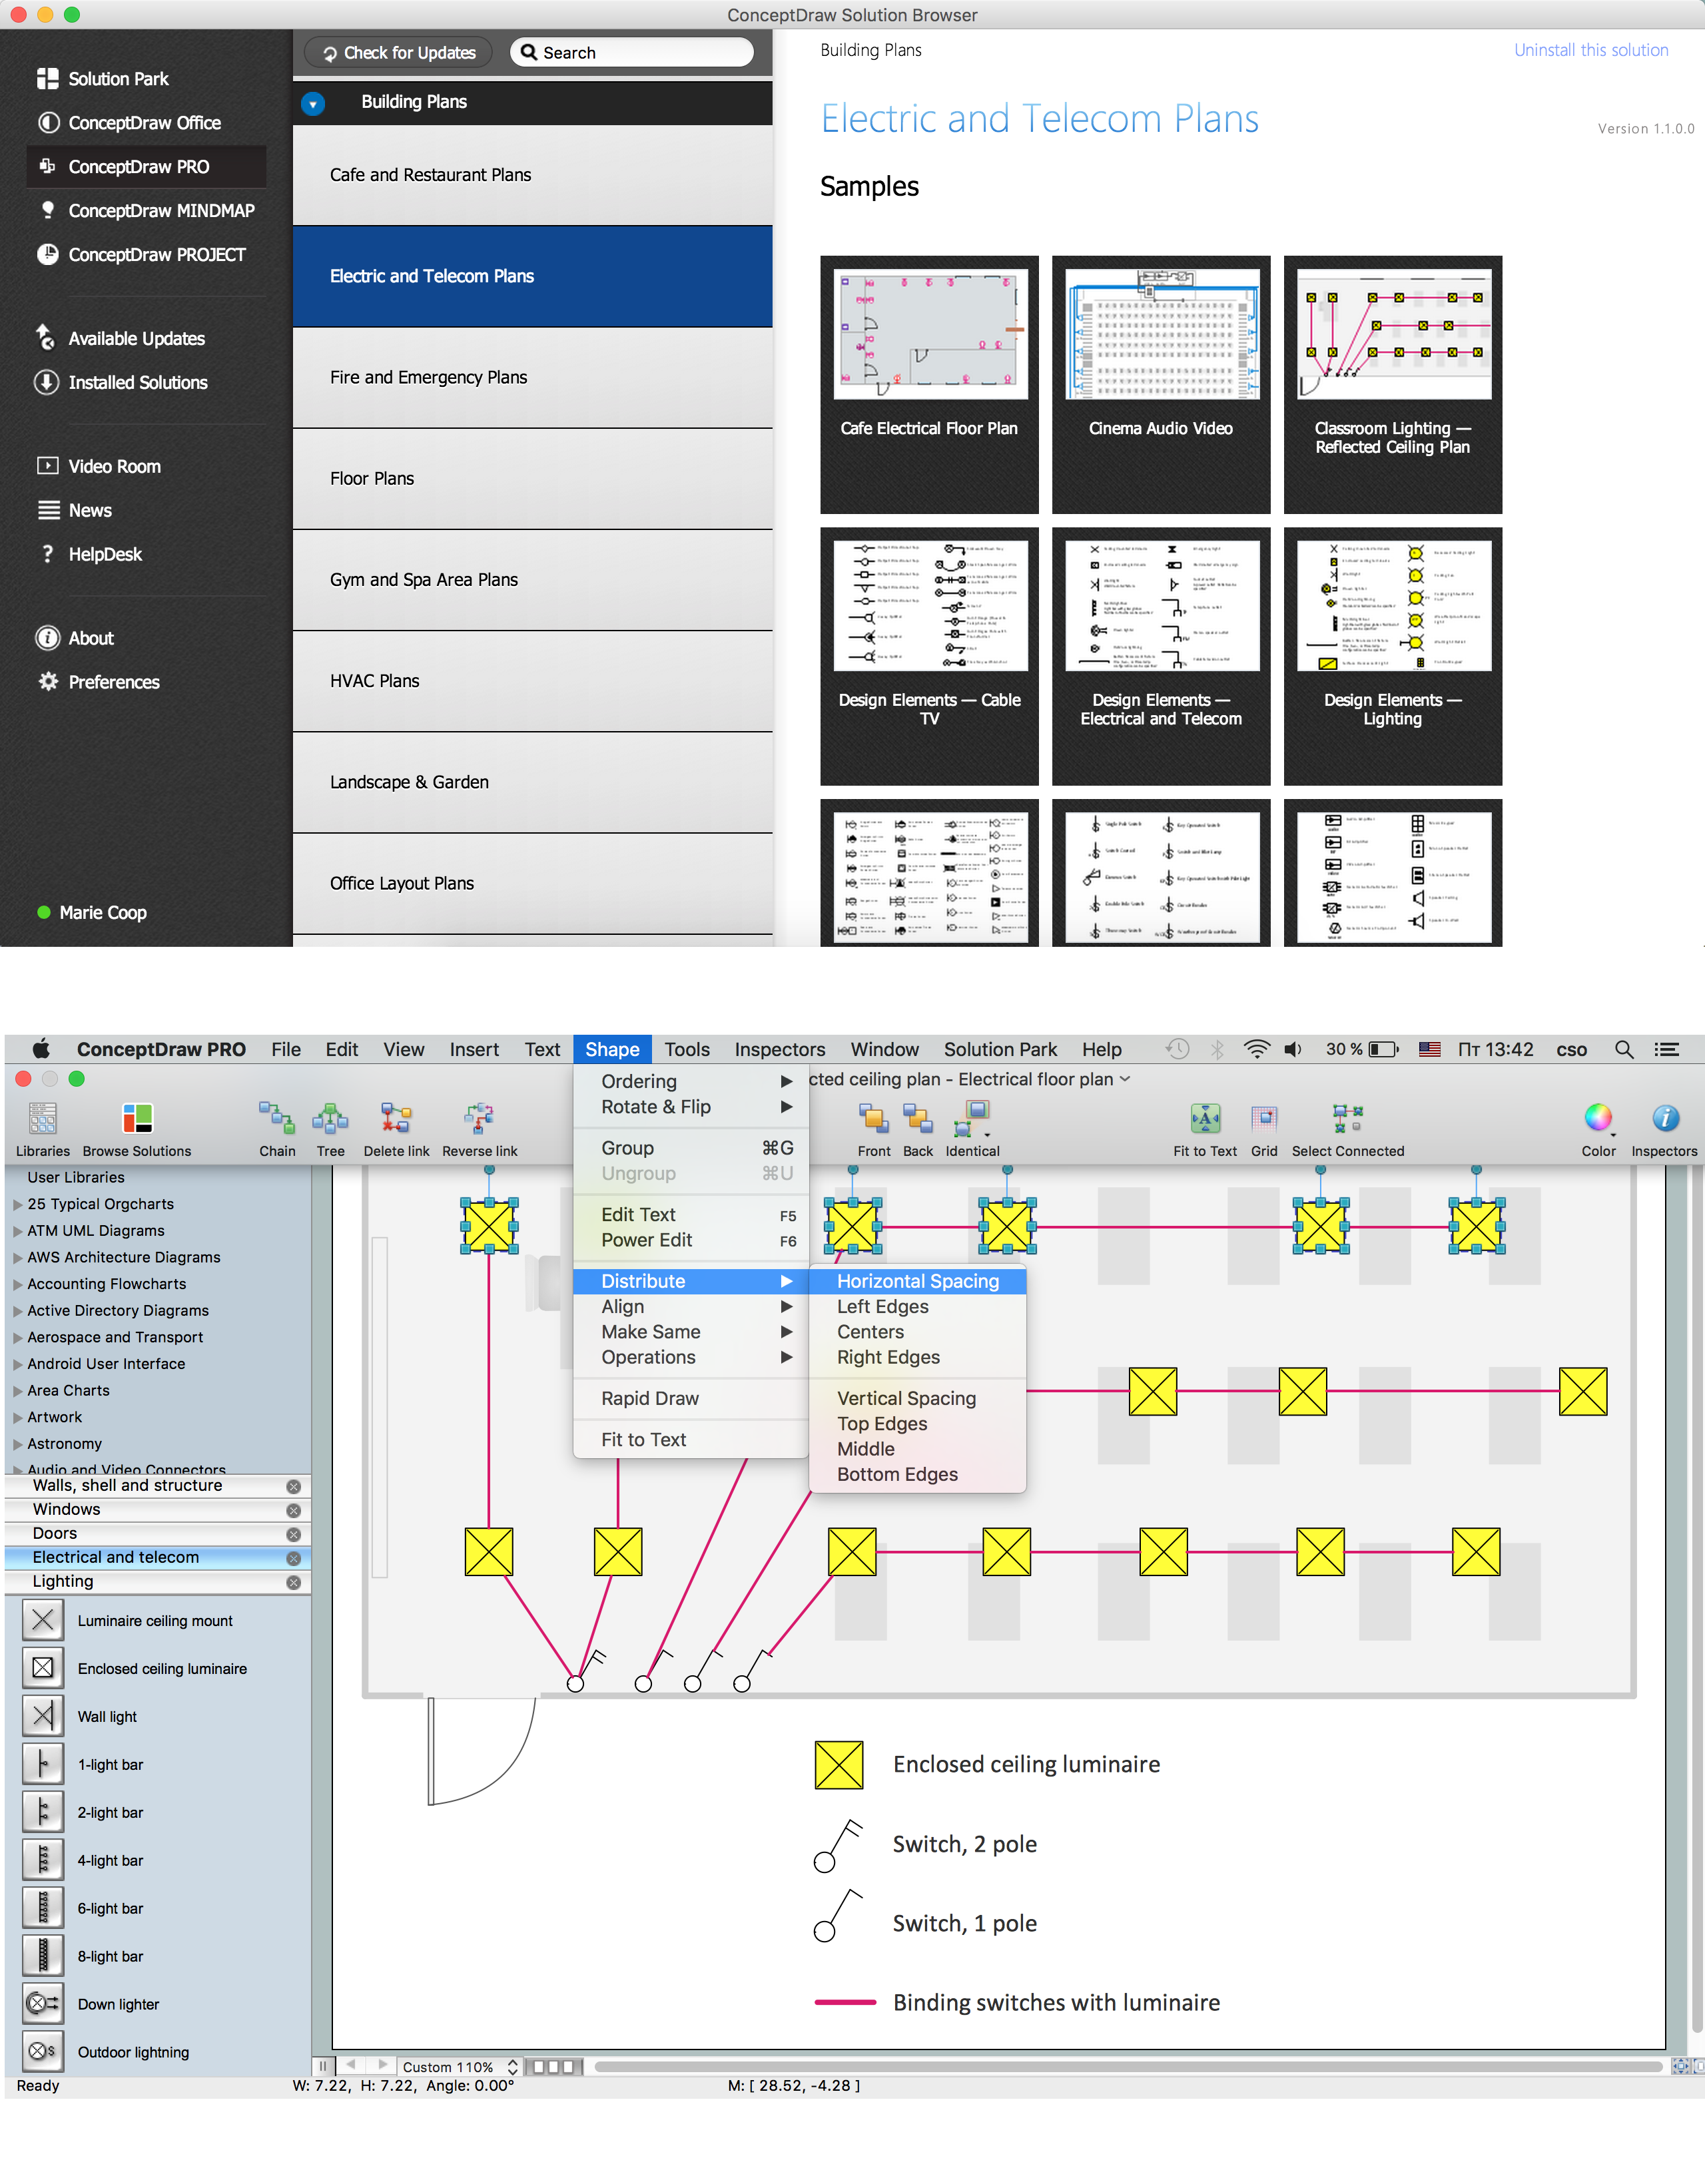
How To use House Electrical Plan Software

House Electrical Plan Software for creating great-looking home floor, electrical plan using professional electrical symbols.
You can use many of built-in templates, electrical symbols and electical schemes examples of our House Electrical Diagram Software.
ConceptDraw is a fast way to draw: Electrical circuit diagrams, Schematics, Electrical Wiring, Circuit schematics, Digital circuits, Wiring in buildings, Electrical equipment, House electrical plans, Home cinema, Satellite television, Cable television, Closed-circuit television.
House Electrical Plan Software works across any platform, meaning you never have to worry about compatibility again. ConceptDraw DIAGRAM allows you to make electrical circuit diagrams on PC or macOS operating systems.
Create an Electrical Diagram

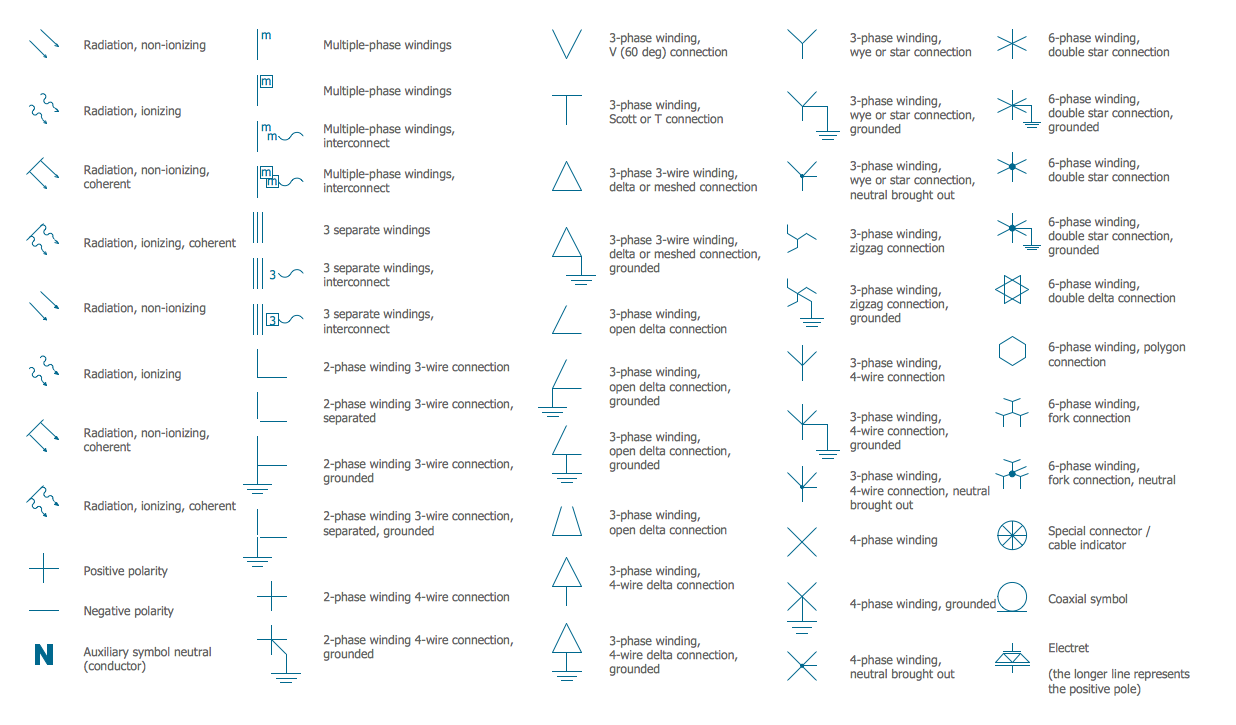
Electrical Symbols, Electrical Diagram Symbols

How to create Electrical Diagram? It’s very easy! All you need is a powerful software. It wasn’t so easy to create Electrical Symbols and Electrical Diagram as it is now with electrical diagram symbols offered by the libraries of Electrical Engineering Solution from the Industrial Engineering Area at the ConceptDraw Solution Park.
This solution provides 26 libraries which contain 926 electrical symbols from electrical engineering: Analog and Digital Logic, Composite Assemblies, Delay Elements, Electrical Circuits, Electron Tubes, IGFET, Inductors, Integrated Circuit, Lamps, Acoustics, Readouts, Logic Gate Diagram, MOSFET, Maintenance, Power Sources, Qualifying, Resistors, Rotating Equipment, Semiconductor Diodes, Semiconductors, Stations, Switches and Relays, Terminals and Connectors, Thermo, Transformers and Windings, Transistors, Transmission Paths,VHF UHF SHF.

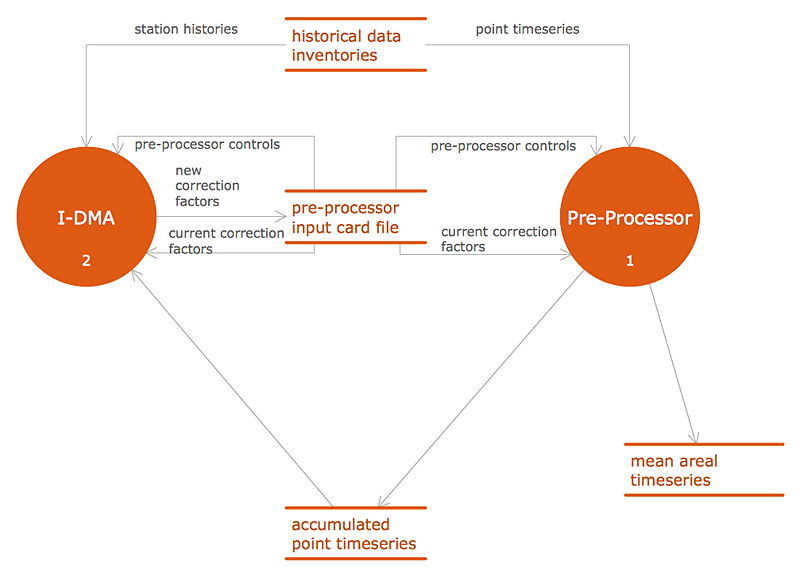
Example of DFD for Online Store (Data Flow Diagram) DFD Example

Data flow diagrams (DFDs) reveal relationships among and between the various components in a program or system. DFDs are an important technique for modeling a system’s high-level detail by showing how input data is transformed to output results through a sequence of functional transformations.
Example of DFD for Online Store shows the Data Flow Diagram for online store and interactions between the Visitors, Customers and Sellers, as well as Website Information and User databases.
Steps to Creating a Sales Process Flow Chart

Process Flowchart

ConceptDraw is Professional business process mapping software for making process flow diagram, workflow diagram, general flowcharts and technical illustrations for business documents. It is includes rich examples, templates, process flowchart symbols. ConceptDraw flowchart maker allows you to easier create a process flowchart. Use a variety of drawing tools, smart connectors, flowchart symbols and shape libraries to create flowcharts of complex processes, process flow diagrams, procedures and information exchange.
How To Create a Process Flow Chart (business process modelling techniques)

Electrical Symbols — Qualifying

A qualifying symbol is graphics or text added to the basic outline of a device’s logic symbol to describe the physical or logical characteristics of the device.

26 libraries of the Electrical Engineering Solution of ConceptDraw DIAGRAM make your electrical diagramming simple, efficient, and effective. You can simply and quickly drop the ready-to-use objects from libraries into your document to create the electrical diagram.

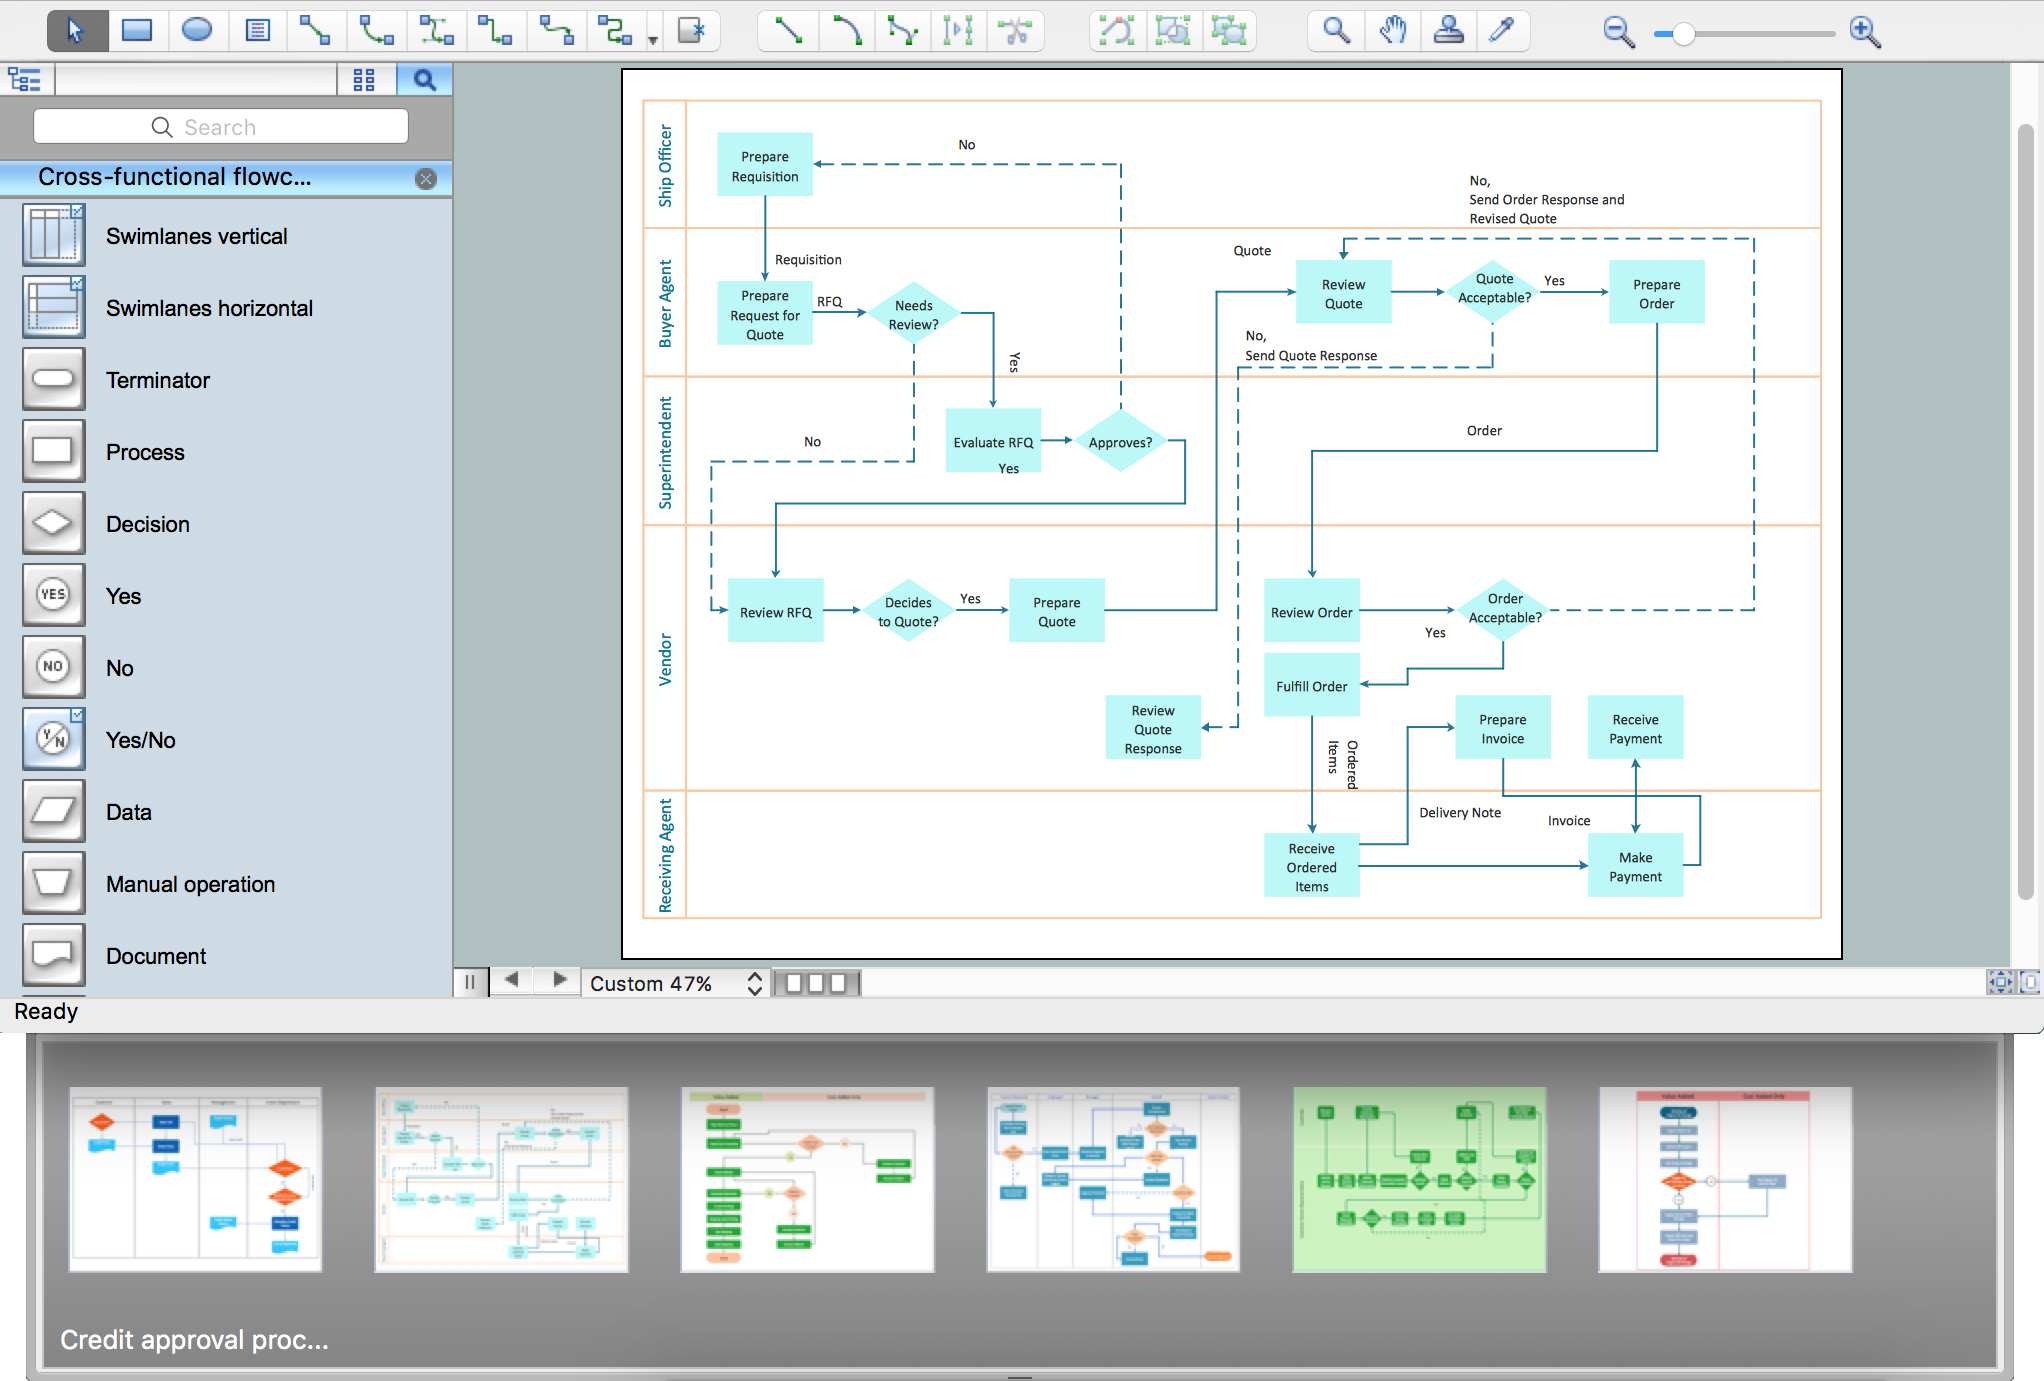
Swim Lane Flowchart Symbols

Use the set of special professionally developed swim lane flowchart symbols - single, multiple, vertical and horizontal lanes from the Swimlanes and Swimlanes BPMN 1.2 libraries from the Business Process Diagram solution, the Swim Lanes library from the Business Process Mapping solution as the perfect basis for your Swim Lane Flowcharts of processes, algorithms and procedures.
HelpDesk

Accounting Information Systems Flowchart Symbols

Accounting Information system is a combination of software and hardware, as well as organizational support. Information system - it is not only the software and computers with network equipment, but also a list of instructions and standards which can be notated using Accounting information systems flowchart symbols. All information systems can be divided into information retrieval and data processing systems. Data Flow model is a hierarchical model. Each process can be divided into structural components, that depict by corresponding flowchart symbols, showing the accounting information system in communication with the external environment. The major components of accounting information systems flowchart are: entities, processes, data stores, and data flows. The set of standard accounting information flowchart symbols is intended to show the relationships between the system components. ConceptDraw DIAGRAM can help to draw clear accounting information system diagrams using special flowchart symbols.