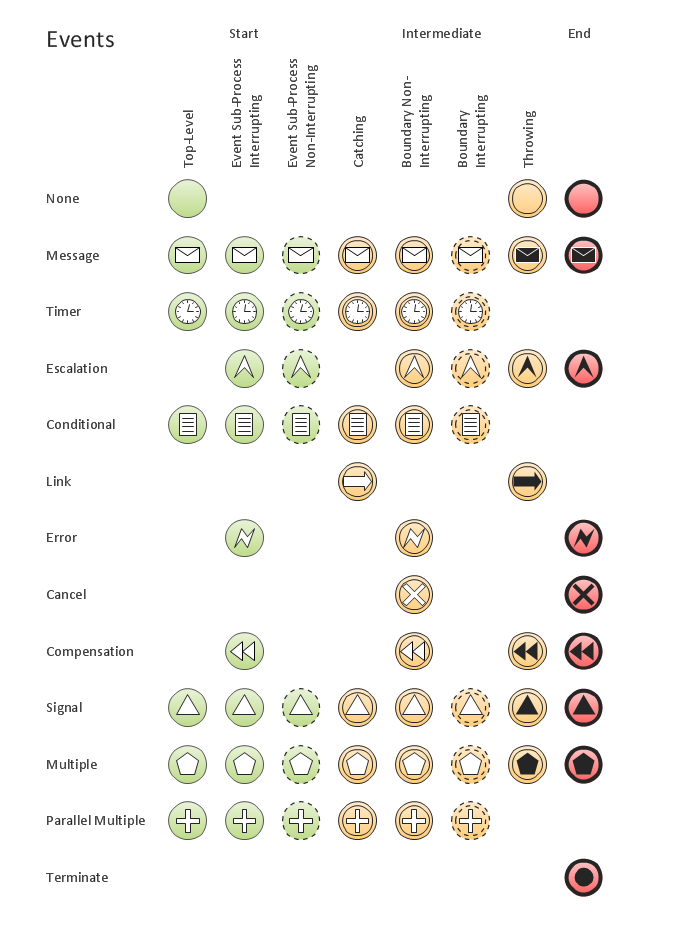
Business Process Elements: Events

How to Make SWOT Analysis in a Word Document

How to Create a PowerPoint Presentation from a SWOT Analysis Mindmap

How To Do A Mind Map In PowerPoint

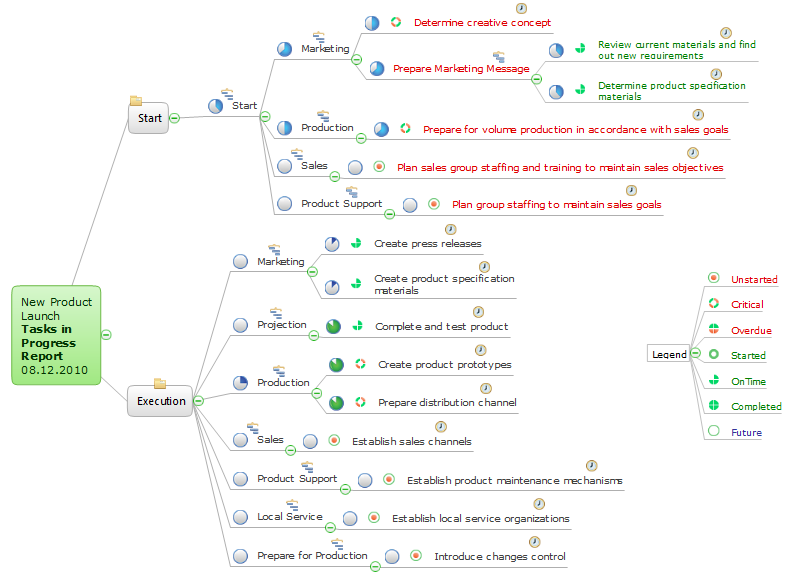
How To Show Project Progress Peport on Web

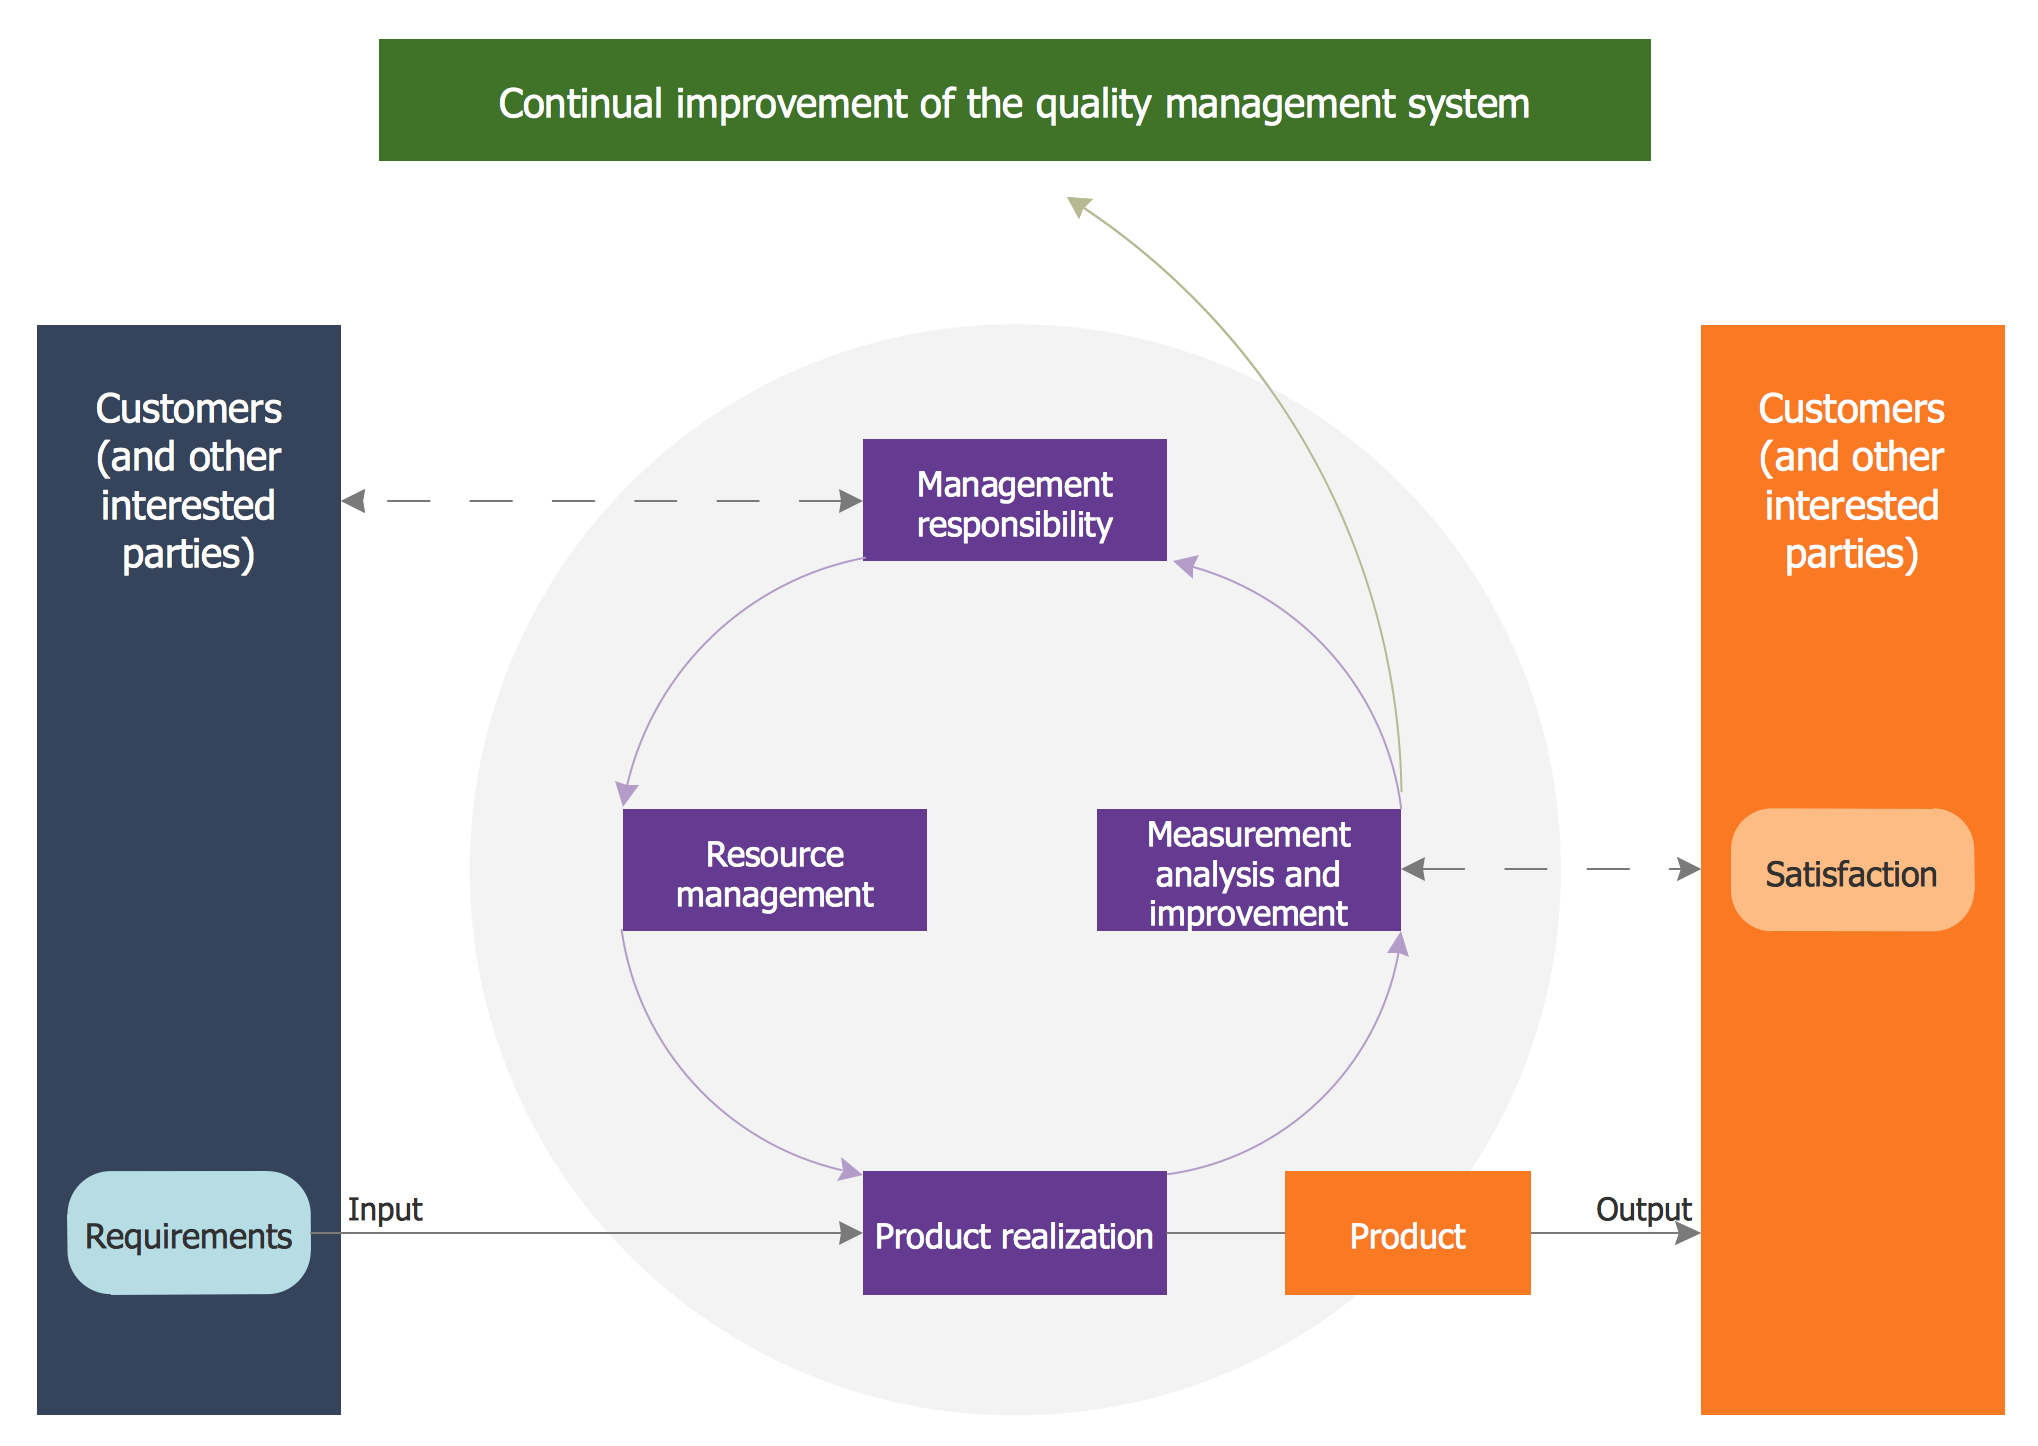
Quality Management System
The Sales Process

Model Based Systems Engineering

Basic Flowchart Examples

 ConceptDraw Solution Park
ConceptDraw Solution Park collects graphic extensions, examples and learning materials
ConceptDraw Solution Park
ConceptDraw Solution Park collects graphic extensions, examples and learning materials
Electric Visual

 iPhone User Interface
iPhone User Interface solution extends ConceptDraw DIAGRAM software with templates, samples and libraries with large quantity of vector stencils of graphical user interface elements, Apps icons, UI patterns for designing and prototyping of the iOS applic
Stakeholder Management System

HelpDesk
How to Add Data-driven Infographics to MS Word Document

- SWOT analysis for a small independent bookstore | Smo Icon
- Cisco Buildings. Cisco icons , shapes, stencils and symbols | SWOT ...
- Swot Icon Png
- Windows Vista graphic user interface - Template | SWOT analysis ...
- SWOT Template | Export from ConceptDraw PRO Document to MS ...
- Chore charts with ConceptDraw PRO | HR professions - Vector ...
- SWOT Matrix Template | Restaurant Floor Plans Software. Design ...
- SWOT and TOWS Matrix Diagrams | Computers and ...
- SWOT Analysis | Fishbone Diagram | Management | A Swot ...
- SWOT Analysis | Winter Sports | ConceptDraw Solution Park ...
- How to Create SWOT Analysis Template Using ConceptDraw PRO ...
- Export from ConceptDraw PRO Document to a Graphic File | SWOT ...
- SWOT Sample in Computers | Gane Sarson Diagram | Diagramming ...
- Swot Analysis For Mechanical Engineering Student
- How to Make SWOT Analysis in a Word Document | SWOT analysis ...
- SWOT Analysis Tool for Small Business | SWOT Analysis | How to ...
- SWOT Analysis Tool for Small Business | 3 Circle Venn Diagram ...
- SWOT Sample in Computers | Local area network (LAN). Computer ...
- How to Make SWOT Analysis in a Word Document | SWOT Analysis ...
- Swot Analysis Example For Student Of Computer Engineering