This site uses cookies. By continuing to browse the ConceptDraw site you are agreeing to our Use of Site Cookies.

SWOT Analysis

The "SWOT Analysis" solution contains easy-to-use mind map templates that help identify Strengths, Weaknesses, Opportunities, and Threats, as well as outputs to ConceptDraw DIAGRAM for presenting analysis results.

Pie Chart Software

A pie chart is a circular diagram showing a set of data divided into proportional slices. There are several variations of this chart such as donut chart, exploded pie chart, multi-level pie charts. Although it is not very informative when a ring chart or circle chart has many sections, so choosing a low number of data points is quite important for a useful pie chart.
ConceptDraw DIAGRAM software with Pie Charts solution helps to create pie and donut charts for effective displaying proportions in statistics, business and mass media for composition comparison, i.e. for visualization of part percentage inside one total.

ConceptDraw MINDMAP : Brainstorming, Mind Mapping for macOS and Windows

ConceptDraw MINDMAP is a powerful business and personal productivity software application that provides visual organization and access to information for individuals and organizations.

Planogram Software and Retail Plan Software

The ConceptDraw DIAGRAM Planogram Software and Retail Plan Software offers powerful tools of Enterprise Architecture Diagrams Solution for visualization the market analysis and easy making successful Retail Plans and Planograms with useful detailed recommendations about placing products and optimization the shelf space.

Using Fishbone Diagrams for Problem Solving

Problems are obstacles and challenges that one should overcome to reach the goal. They are an inseparable part of any business, and the success of an enterprise often depends on ability to solve all problems effectively. The process of problem solving often uses rational approach, helping to find a suitable solution.
Using Fishbone Diagrams for Problem Solving is a productive and illustrative tool to identify the most important factors causing the trouble. ConceptDraw DIAGRAM extended with Fishbone Diagrams solution from the Management area of ConceptDraw Solution Park is a powerful tool for problem solving with Fishbone Ishikawa diagram graphic method.

Best Diagramming

Need to draw a diagram, process chart, flowchart, organizational chart, graphic design? ConceptDraw can help you to make professional graphic documents quickly.
How to Draw a Bubble Chart

Network Configuration

ConceptDraw DIAGRAM extended with Computer & Network solution allows quickly create professional network configuration diagrams using design objects libraries, templates and stencils, and then convert the document to PDF, PowerPoint presentation, web-page and many other popular formats.
HelpDesk

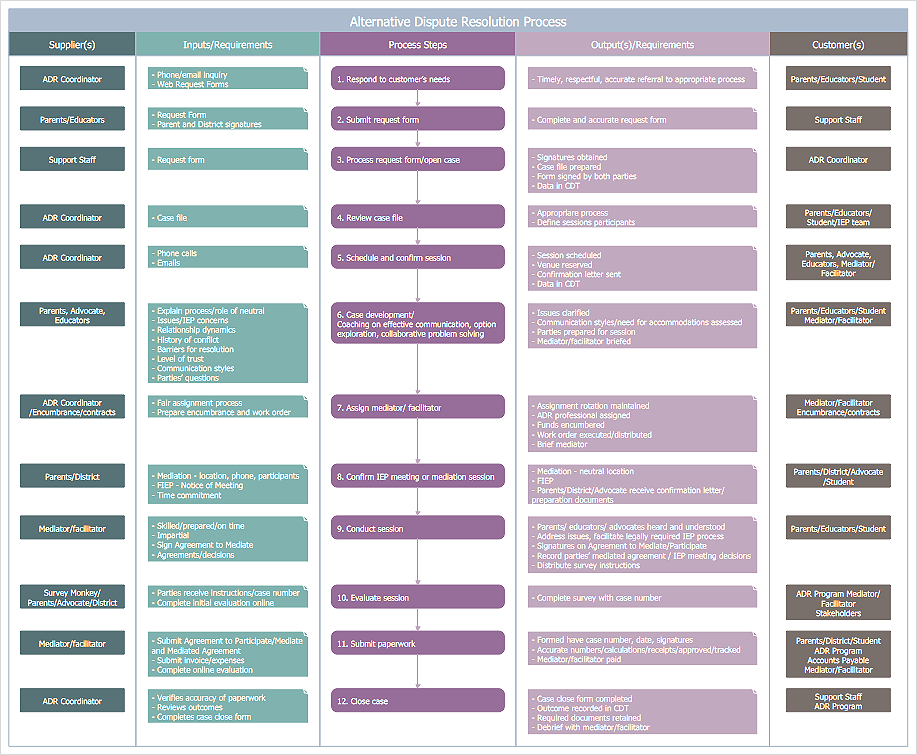
How to Create a SIPOC Diagram

SIPOC (suppliers, inputs, process, outputs, customers) diagram is focused on the quality of a business process inputs and outputs. SIPOC diagram has a form of a segmented table that gives a comprehensive outline for each category. SIPOC diagram depicts the start and end of a process and the relationships between a company and its suppliers. SIPOC diagram is an important part of the Six Sigma methodology. With its Business Process Mapping solution, ConceptDraw DIAGRAM offers a powerful set of process mapping tools to empower quality management within an organization.

Computer Hardware - Reseller Business Plan

A more detailed mind map of a business plan for a computer hardware reseller.

IDEF1 standard

Use Case Diagrams technology. Using visual graphical objects IDEF1 standard allows to model information interrelations.