SWOT Analysis Solution - Strategy Tools
The condition and successful development of the company depends on how efficiently it is able to react on different outside influences. Analysis and interrelated consideration of external factors and the company's capabilities allow effectively solve appearing problems. One of the most common methods of evaluation together internal and external factors influencing the company's development is SWOT analysis elaborated for business and industry. It is a necessary element of researches and obligatory preliminary stage at the preparation of strategic and marketing plans of the company. Upon the results of SWOT analysis, we can assess does the company have the internal forces and resources to realize the existing opportunities and resist external threats, and what internal deficiencies require the prompt rectification. ConceptDraw DIAGRAM software enhanced with SWOT Analysis solution offers powerful drawing and strategy tools for effective execution the SWOT and TOWS analysis for your company with a goal of effectively realizing strategic planning and correct decision-making.ConceptDraw DIAGRAM
ConceptDraw DIAGRAM is a powerful business and technical diagramming software tool that enables you to design professional-looking graphics, diagrams, flowcharts, floor plans and much more in just minutes. Maintain business processes performance with clear visual documentation. Effectively present and communicate information in a clear and concise manner with ConceptDraw DIAGRAM.                        
                            
                                
                                Entity-Relationship Diagram  (ERD)                             


                            Entity-Relationship Diagram (ERD) solution extends ConceptDraw DIAGRAM software with templates, samples and libraries of vector stencils from drawing the ER-diagrams by Chen's and crow’s foot notations.                        
                    Relative Value Chart Software
Relative value is a value measured in the terms of liquidity, risks, return of one investment or financial instrument relative to another. Relative values are widely used in:business, economics, investment, management, marketing, statistics, etc. ConceptDraw DIAGRAM software is the best for drawing professional looking Relative Value Charts. ConceptDraw DIAGRAM provides Divided Bar Diagrams solution from the Graphs and Charts Area of ConceptDraw Solution Park.                        
                            
                                
                                Education                            


                            This solution extends ConceptDraw DIAGRAM and ConceptDraw MINDMAP with specific content that helps illustrate educational documents, presentations, and websites quickly and easily with astronomy, chemistry, math and physics vector pictures and clip art.                        
                    Biology Drawing
It is impossible to imagine the biology science without drawings. Drawings are very convenient way to explain the different biological knowledge and processes. If you dream to design any biology drawing quick and easy – the ConceptDraw DIAGRAM software is exactly what you need. ConceptDraw DIAGRAM diagramming and vector drawing software extended with Biology solution from the Science and Education area offers the useful tools for easy biology drawing.                        
                            
                                
                                Illustration                            


                            This solution extends ConceptDraw DIAGRAM.4, allowing you to make professional-looking documents, presentations and websites illustrated with color, scalable vector clip art and shapes, regardless of drawing skills.                        


                                Entity-Relationship Diagram  (ERD)                             


                            An Entity-Relationship Diagram (ERD) is a visual presentation of entities and relationships. That type of diagrams is often used in the semi-structured or unstructured data in databases and information systems.   At first glance ERD is similar to a flowch                        
                    Looking at ConceptDraw MINDMAP as a Replacement for Mindjet Mindmanager
The comparing of ConceptDraw MINDMAP to Mindjet Mindmanager allows to identify a lot of benefits. At first, the ConceptDraw MINDMAP has a lower price, the flexible licensing, the license is per-named-user, no charge for major product upgrades and no charge for support. ConceptDraw MINDMAP is effective for launching the stalled projects to new heights, it possess the excellent possibility of importing and exporting to other mind mapping program file formats. ConceptDraw MINDMAP easily integrates with wide set of programs, among them Evernote, Skype, Twitter, Microsoft Word, Microsoft PowerPoint, Microsoft Project, Mindjet Mindmanager, ConceptDraw PROJECT, ConceptDraw DIAGRAM , with solutions from ConceptDraw Solution Park. Now you have a freedom to choose the best format for each your document, it is incredibly easy to make the Skype presentation, to take and share critical information, to send your Mind Map to Evernote, to import / export MS Word documents, MS PowerPoint presentations, the project data, open and save Mindmanager files, to map out the long-term Twitter messages and publish them to your Twitter account directly from a Mind Map.                        
                            
                                
                                Event-driven Process Chain Diagrams                            


                            Event-Driven Process Chain Diagrams solution extends ConceptDraw DIAGRAM functionality with event driven process chain templates, samples of EPC engineering and modeling the business processes, and a vector shape library for drawing the EPC diagrams and EPC flowcharts of any complexity. It is one of EPC IT solutions that assist the marketing experts, business specialists, engineers, educators and researchers in resources planning and improving the business processes using the EPC flowchart or EPC diagram. Use the EPC solutions tools to construct the chain of events and functions, to illustrate the structure of a business process control flow, to describe people and tasks for execution the business processes, to identify the inefficient businesses processes and measures required to make them efficient.                          


                                Mechanical Engineering                            


                            This solution extends ConceptDraw DIAGRAM.9 mechanical drawing software (or later) with samples of mechanical drawing symbols, templates and libraries of design elements, for help when drafting mechanical engineering drawings, or parts, assembly, pneumatic,                        
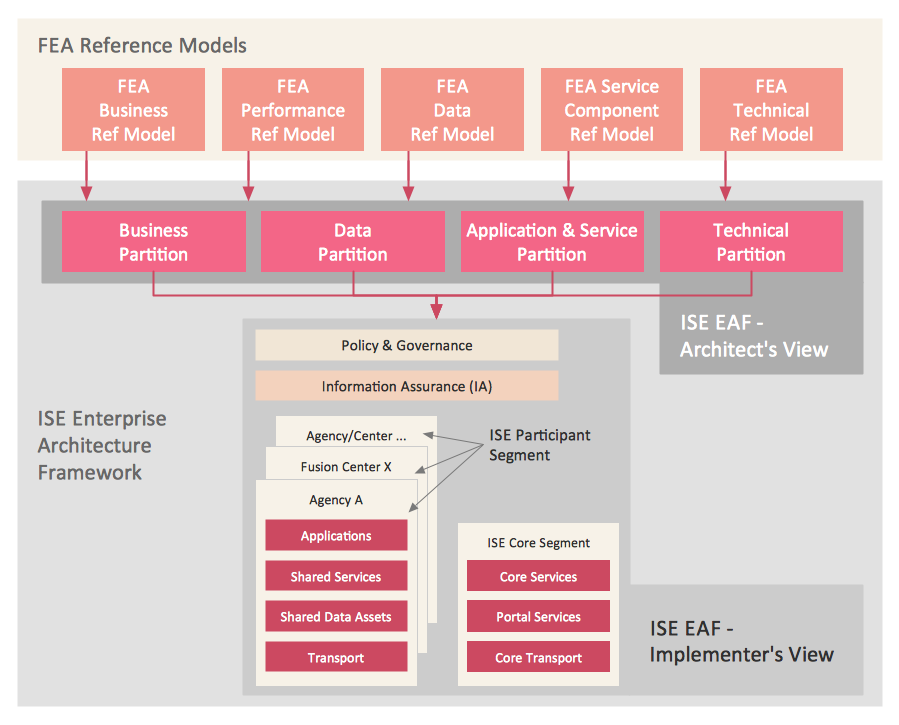
                    What Is Information Architecture
What is information architecture? Information architecture (IA) is a broad and abstract term. At the most general sense the information architecture describes the structure of a system, how the different pieces of information are related at the system and represents their relationships. The information architecture term was introduced by Richard Saul Wurman in 1975 and now is commonly used in the context of websites and intranets, information structures and computer systems. ConceptDraw DIAGRAM extended with Enterprise Architecture Diagrams Solution from the Management Area is the best software for design information architecture and drawing Enterprise Architecture Diagrams.                        
                            
                                
                                School and Training Plans                            


                            School and Training Plans solution enhances ConceptDraw DIAGRAM functionality with extensive drawing tools, numerous samples and examples, templates and libraries of classroom design elements for quick and professional drawing the School and Training plans, School Floor plans, Classroom Layout, Classroom Seating chart, Lecture Room plans of any complexity. Each offered classroom seating chart template is a real help for builders, designers, engineers, constructors, as well as teaching personnel and other teaching-related people in drawing Classroom Seating charts and Training Room layouts with ConceptDraw DIAGRAM classroom seating chart maker.                        


                                Computer Network Diagrams                            


                            Computer Network Diagrams solution extends ConceptDraw DIAGRAM software with samples, templates and libraries of vector icons and objects of computer network devices and network components to help you create professional-looking Computer Network Diagrams, to plan simple home networks and complex computer network configurations for large buildings, to represent their schemes in a comprehensible graphical view, to document computer networks configurations, to depict the interactions between network's components, the used protocols and topologies, to represent physical and logical network structures, to compare visually different topologies and to depict their combinations, to represent in details the network structure with help of schemes, to study and analyze the network configurations, to communicate effectively  to engineers, stakeholders and end-users, to track network working and troubleshoot, if necessary.                        
                    - Personal  Swot Analysis Examples  For  Students 
 -  Samples  Of  Students Swot Analysis 
 - Personal  Swot Analysis Example Student 
 -  Swot Analysis  On Yourself  Example  For University  Students 
 -  Swot Analysis  For Engineering  Students Examples 
 -  Example  Of Personal  Swot Analysis  Of A  Student 
 -  Examples  Of  Swot Analysis  For  Students 
 -  Swot Analysis  Ppt For  Students 
 -  Swot Analysis Example Student 
 -  Swot Analysis Student 
 -  SWOT Analysis  | How to Create  SWOT Analysis Template  Using ...
 -  Example  Of  Swot  For  Students  Project
 -  Swot Analysis  For  Students 
 - Personal  Swot Analysis Examples  Of Mechanical Engineers
 - How to Create  SWOT Analysis Template  Using ConceptDraw PRO ...
 - SWOT Matrix  Template  |  SWOT analysis  matrix diagram  templates  ...
 -  Swot Analysis  For Mechanical Engineering  Student 
 - Engineering  Swot Analysis Example 
 -  Swot Analysis  Of  Student  About Personal How To Write
 -  Swot Analysis  Of Engineer  Sample