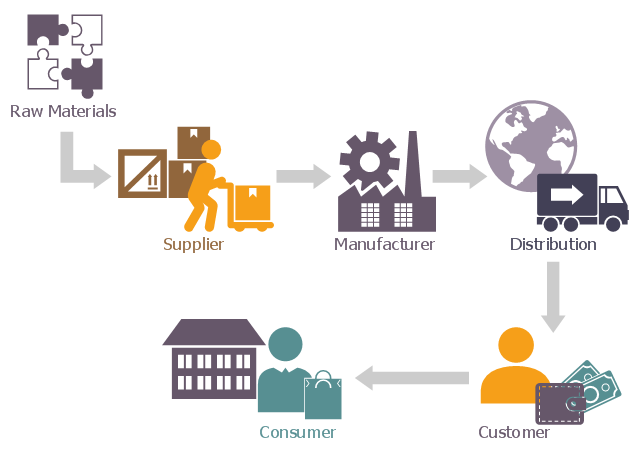
This basic diagram of supply chain network showing the movement of goods from the raw materials stage into the hands of the end consumer.
It was designed on the base of the Wikimedia Commons file: Supply chain network.png. [commons.wikimedia.org/ wiki/ File:Supply_ chain_ network.png]
This file is licensed under the Creative Commons Attribution-Share Alike 4.0 International license. [creativecommons.org/ licenses/ by-sa/ 4.0/ deed.en]
"A supply chain is a system of activities involved in handling, distributing, manufacturing and processing goods in order to move resources from a vendor into the hands of the final consumer. A supply chain is a complex network of interconnected players governed by supply and demand." [Supply chain attack. Wikipedia]
The logistic flowchart example "Supply chain network" was created using ConceptDraw PRO diagramming and vector drawing software extended with the Logistics Flow Charts solution from the Business Processes area of ConceptDraw Solution Park.
Logistic flowchart
 Logistics Flow Charts
Logistics Flow Charts solution extends ConceptDraw PRO v11 functionality with opportunities of powerful logistics management software. It provides large collection of predesigned vector logistic symbols, pictograms, objects and clipart to help you design with pleasure Logistics flow chart, Logistics process flow diagram, Inventory flow chart, Warehouse flowchart, Warehouse management flow chart, Inventory control flowchart, or any other Logistics diagram. Use this solution for logistics planning, to reflect logistics activities and processes of an enterprise or firm, to depict the company's supply chains, to demonstrate the ways of enhancing the economic stability on the market, to realize logistics reforms and effective products' promotion.
UML Component Diagram


Process Flowchart


Context Diagram Template

This template shows the Context Diagram. It was created in ConceptDraw PRO diagramming and vector drawing software using the Block Diagrams Solution from the “Diagrams” area of ConceptDraw Solution Park. The context diagram graphically identifies the system. external factors, and relations between them. It’s a high level view of the system. The context diagrams are widely used in software engineering and systems engineering for designing the systems that process the information.
Process Flow Chart Examples

Sales Process Flowchart. Flowchart Examples

Value Stream Diagram

 Value Stream Mapping
Value stream mapping solution extends ConceptDraw PRO software with templates, samples and vector stencils for drawing the Value Stream Maps (VSM) in lean manufacturing practice.
Best Value Stream Mapping mac Software
 diagram")
- Intermodal transport chain | Supply chain network | Logistics Flow ...
- Shipping And Logistics Process Flow Chart
- Shipping And Logistics Flow Chart Process
- Ocean Shipment Flow Chart
- Value Stream Mapping Symbols | Process Flowchart | EPC ...
- Shipping Logistics Process In Flowchart
- Port And Shipping Management System Uml
- Order To Delivery Process Flow Chart
- Shipment Status Template