HelpDesk
How to Draw a Divided Bar Chart in ConceptDraw PRO

 Divided Bar Diagrams
The Divided Bar Diagrams Solution extends the capabilities of ConceptDraw PRO v10 with templates, samples, and a library of vector stencils for drawing high impact and professional Divided Bar Diagrams and Graphs, Bar Diagram Math, and Stacked Graph.
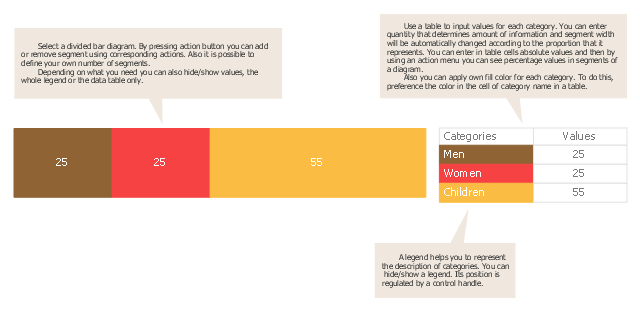
Use this chart template to design your divided bar diagrams.
A divided bar chart is a rectangle divided into segments, illustrating numerical proportion. In a divided bar chart, the length of each segment (and consequently its area), is proportional to the quantity it represents.
This divided bar graph displays the number of people per day who visited swimming pool.
The template "Divided bar diagram" for the ConceptDraw PRO diagramming and vector drawing software is included in the Divided Bar Diagrams solution from the Graphs and Charts area of ConceptDraw Solution Park.
Template
Bar Diagram Math

The vector stencils library "Divided bar diagrams" contains 12 templates of divided bar diagrams for visualizing percent composition of one total consists of few components.
Drag the template from the library to your document and enter your data.
Use these shapes to draw your divided bar diagrams in the ConceptDraw PRO diagramming and vector drawing software.
The vector stencils library "Divided bar diagrams" is included in the Divided Bar Diagrams solution from the Graphs and Charts area of ConceptDraw Solution Park.
Divided bar diagram (orange)
-divided-bar-diagrams---vector-stencils-library.png--diagram-flowchart-example.png)
Divided bar diagram (orange) 2
-2-divided-bar-diagrams---vector-stencils-library.png--diagram-flowchart-example.png)
Divided bar diagram (blue)
-divided-bar-diagrams---vector-stencils-library.png--diagram-flowchart-example.png)
Divided bar diagram (blue) 2
-2-divided-bar-diagrams---vector-stencils-library.png--diagram-flowchart-example.png)
Divided bar diagram (green)
-divided-bar-diagrams---vector-stencils-library.png--diagram-flowchart-example.png)
Divided bar diagram (green) 2
-2-divided-bar-diagrams---vector-stencils-library.png--diagram-flowchart-example.png)
Divided bar diagram (aquamarine)
-divided-bar-diagrams---vector-stencils-library.png--diagram-flowchart-example.png)
Divided bar diagram (aquamarine) 2
-2-divided-bar-diagrams---vector-stencils-library.png--diagram-flowchart-example.png)
Divided bar diagram (gray)
-divided-bar-diagrams---vector-stencils-library.png--diagram-flowchart-example.png)
Divided bar diagram (gray) 2
-2-divided-bar-diagrams---vector-stencils-library.png--diagram-flowchart-example.png)
Divided bar diagram (table)
-divided-bar-diagrams---vector-stencils-library.png--diagram-flowchart-example.png)
Divided bar diagram (table) 2
-2-divided-bar-diagrams---vector-stencils-library.png--diagram-flowchart-example.png)
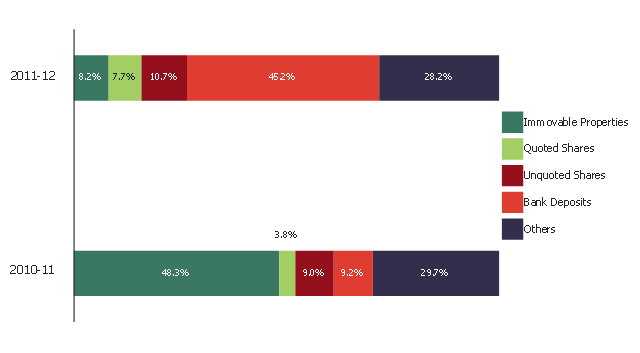
This divided bar diagram sample shows the compisition of estates in 2010-11 and 2011-12. It was created on the base of the figure "Composition of estates" from the website of the Inland Revenue Department of the Government of the Hong Kong Special Administrative Region.
[ird.gov.hk/ dar/ 2011-12/ en/ assessing.html]
"An estate is the net worth of a person at any point in time alive or dead. It is the sum of a person's assets - legal rights, interests and entitlements to property of any kind - less all liabilities at that time. The issue is of special legal significance on a question of bankruptcy and death of the person.
Depending on the particular context, the term is also used in reference to an estate in land or of a particular kind of property (such as real estate or personal estate). The term is also used to refer to the sum of a person's assets only." [Estate (law). Wikipedia]
The example "Composition of estates" was created using the ConceptDraw PRO diagramming and vector drawing software extended with the Divided Bar Diagrams solution from the Graphs and Charts area of ConceptDraw Solution Park.
Divided bar chart
 Bar Graphs
The Bar Graphs solution enhances ConceptDraw PRO v10 functionality with templates, numerous professional-looking samples, and a library of vector stencils for drawing different types of Bar Graphs, such as Simple Bar Graph, Double Bar Graph, Divided Bar Graph, Horizontal Bar Graph, Vertical Bar Graph, and Column Bar Chart.
Bar Diagrams for Problem Solving. Create space science bar charts with Bar Graphs Solution

Rainfall Bar Chart

Bar Graph

Sales Growth. Bar Graphs Example

Bar Diagrams for Problem Solving. Create economics and financial bar charts with Bar Graphs Solution

Stacked Graph

Best Diagramming


Simple Diagramming


- How to Draw a Divided Bar Chart in ConceptDraw PRO | Venn ...
- How to Draw a Divided Bar Chart in ConceptDraw PRO | Divided ...
- SYSML | Steps Of Sub Divided Bar Diagram
- Sub Divided Bar Diagram With Schedule
- Subdivided Bar Diagram Examples
- Subdivided Bar Diagram Examples With Daigram
- Steps To Draw Sub Divided Bar Diagram
- Sub Divided Bar Diagram With Difination
- How to Draw a Divided Bar Chart in ConceptDraw PRO | Basic ...
- Rainfall Bar Chart | Divided Bar Diagrams | Chart Software for Better ...
- Divided bar diagram - Template | Bar Diagram Math | Relative Value ...
- How To Describe A Bar Diagram Using Conjunction
- How to Draw a Divided Bar Chart in ConceptDraw PRO | Divided ...
- Divided Bar Diagrams | Design elements - Composition charts and ...
- Rainfall Bar Chart | Bar Diagram Math | Divided bar diagram ...
- Divided Bar Diagrams
- Bar Diagram Math | Process Flow Diagram | Divided Bar Diagrams ...
- Divided Bar Diagrams
- Divided Bar Diagrams | Competitor Analysis | How To Draw A ...
- Bar Diagram Math | Chart Software for Better Presentations | Divided ...