Reviews and feedback have great importance in the sphere of business promotion and help to establish the profitable relationships. They are one of the most effective marketing tools that contribute to increasing sales. Unfortunately, many entrepreneurs in their work often miss the importance of this moment. However the reading and processing of comments and feedback of customers and influencers, and recording the interesting ideas that they include, is very important for any business. No matter what they contain - complaints or praise, but this information cannot be ignored. If previously the gathering of feedback about the product was a very long and laborious process, demanding a lot of time, effort and patience, now all is much easier. Today, in the age of digital technologies, are widespread the reviews on company websites and various social networks.
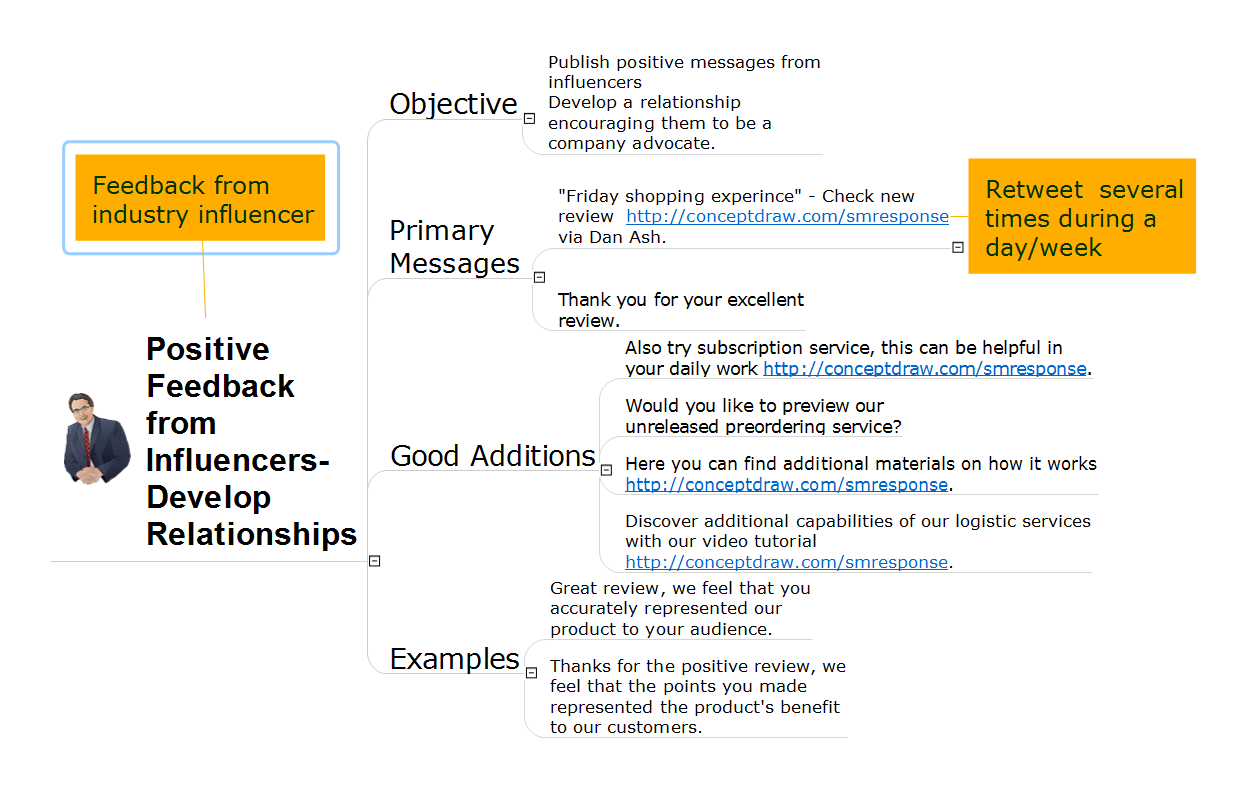
This action Mind Map designed in ConceptDraw MINDMAP software helps to correctly respond to positive feedback from the well-known or industry influencers. The represented ready response phrases can be used for quick composing and tweeting/posting response messages.