This vector stencils library contains 12 object schematic symbols.
Use it to design your IDEF3 diagrams with ConceptDraw PRO diagramming and vector drawing tools.
The vector stencils library "IDEF3 object schematic symbols" is included in the IDEF Business Process Diagrams solution from the Business Processes area of ConceptDraw Solution Park.
Use it to design your IDEF3 diagrams with ConceptDraw PRO diagramming and vector drawing tools.
The vector stencils library "IDEF3 object schematic symbols" is included in the IDEF Business Process Diagrams solution from the Business Processes area of ConceptDraw Solution Park.
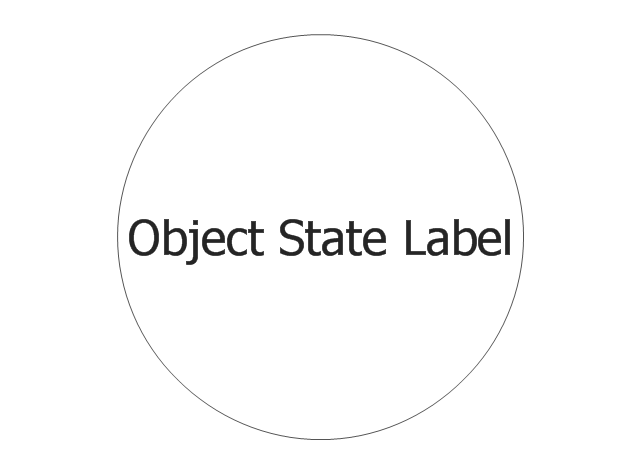
Object
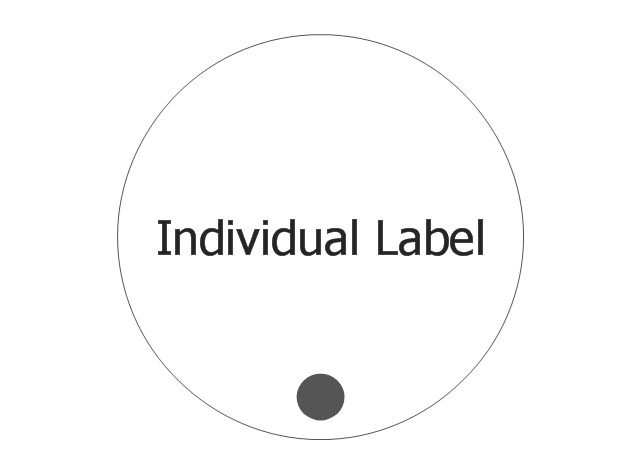
Individual
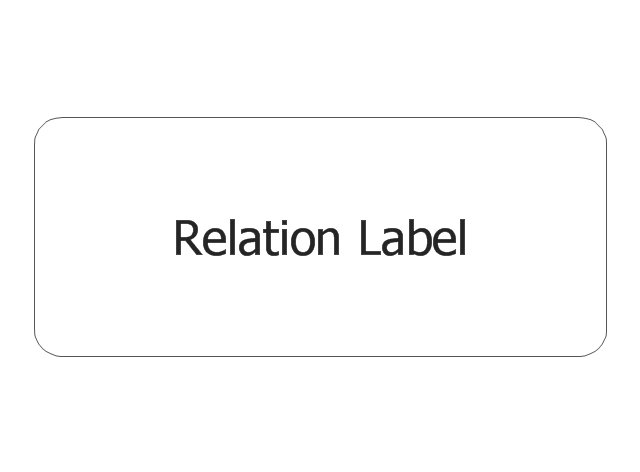
Weak Transition Link

Strong Transition Link

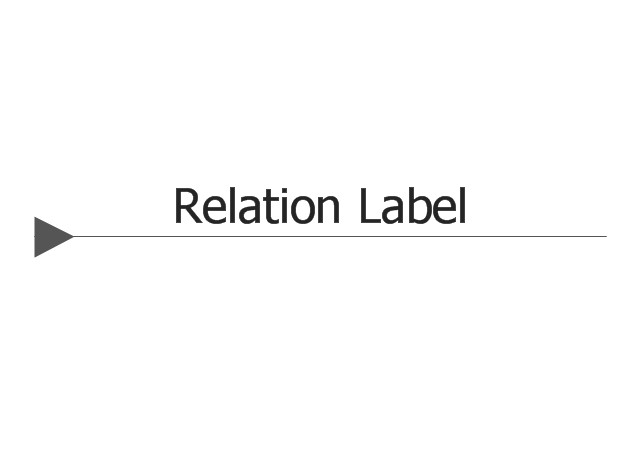
n-Place 1st-order Relation
2-Place 2nd-order Relation
AND Junction (object)
-vector-stencils-library---idef3-object-schematic-symbols.png--diagram-flowchart-example.png)
OR Junction (object)
-vector-stencils-library---idef3-object-schematic-symbols.png--diagram-flowchart-example.png)
XOR Junction (object)
-vector-stencils-library---idef3-object-schematic-symbols.png--diagram-flowchart-example.png)
Connecting arrow
Connecting line

Temporal Indeterminacy Marker

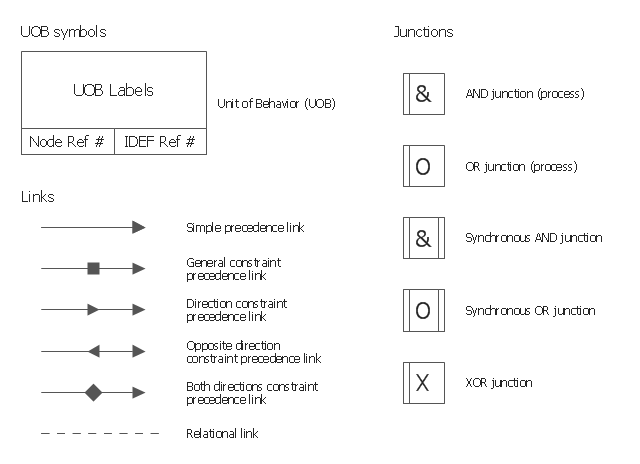
The vector stencils library "IDEF3 process schematic symbols" contains 12 shapes: unit of behavior (UOB), links, junctions, .
Use it to design your IDEF3 process schematic diagrams.
"Process schematics tend to be the most familiar and broadly used component of the IDEF3 method. These schematics provide a visualization mechanism for processcentered descriptions of a scenario. The graphical elements that comprise process schematics include Unit of Behavior (UOB) boxes, precedence links, junctions, referents, and notes. The building blocks here are:
- Unit of Behavior (UOB) boxes.
- Links: Links are the glue that connect UOB boxes to form representations of dynamic processes.
- Simple Precedence Links: Precedence links express temporal precedence relations between instances of one UOB and those of another.
- Activation Plots: Activation plots are used to represent activations.
- Dashed Links: Dashed links carry no predefined semantics.
- Link Numbers: All links have an elaboration and unique link numbers.
Activation Semantics for Nonbranching Process Schematics.
- Junctions: Junctions in IDEF3 provide a mechanism to specify the logic of process branching.
- UOB Decompositions: Elaborations capture and structure detailed knowledge about processes.
- UOB Reference Numbering Scheme: A UOB box number is assigned to each UOB box in an IDEF3 Process Description.
- Partial Descriptions: UOB boxes are joined together by links. Because of the description capture focus of IDEF3, it is possible to conceive of UOBs without links to other parts of an IDEF3 schematic.
- Referents: Referents enhance understanding, provide additional meaning, and simplify the construction (i.e., minimize clutter) of both process schematics and object schematics." [IDEF3. Wikipedia]
The shapes example "Design elements - IDEF3 process schematic symbols" was created using the ConceptDraw PRO diagramming and vector drawing software extended with the solution "IDEF Business Process Diagrams" from the area "Business Processes" of ConceptDraw Solution Park.
IDEF3 business process diagram
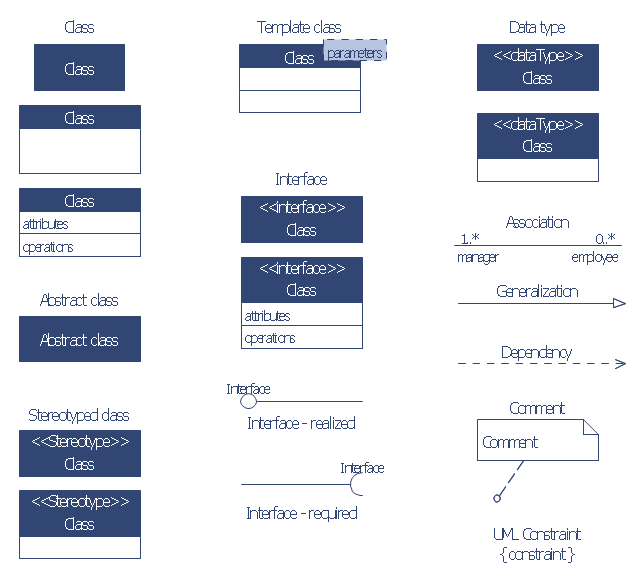
The vector stencils library "Bank UML class diagram" contains 19 shapes for drawing UML class diagrams.
Use it for object-oriented modeling of your bank information system.
"The class diagram is the main building block of object oriented modelling. It is used both for general conceptual modelling of the systematics of the application, and for detailed modelling translating the models into programming code. Class diagrams can also be used for data modeling. The classes in a class diagram represent both the main objects, interactions in the application and the classes to be programmed.
In the diagram, classes are represented with boxes which contain three parts:
* The top part contains the name of the class. It is printed in bold and centered, and the first letter is capitalized.
* The middle part contains the attributes of the class. They are left-aligned and the first letter is lowercase.
* The bottom part contains the methods the class can execute. They are also left-aligned and the first letter is lowercase.
In the design of a system, a number of classes are identified and grouped together in a class diagram which helps to determine the static relations between those objects. With detailed modelling, the classes of the conceptual design are often split into a number of subclasses." [Class diagram. Wikipedia]
This example of UML class diagram symbols for the ConceptDraw PRO diagramming and vector drawing software is included in the ATM UML Diagrams solution from the Software Development area of ConceptDraw Solution Park.
UML class diagram symbols
"Crow's Foot notation is used in Barker's Notation, SSADM and Information Engineering. Crow's Foot diagrams represent entities as boxes, and relationships as lines between the boxes. Different shapes at the ends of these lines represent the cardinality of the relationship." [Entity–relationship model. Wikipedia]
The vector stencils library ERD, crow's foot notation contains 17 symbols for creating the ER-diagrams using the ConceptDraw PRO diagramming nd vector drawing software.
The example"Design elements - ERD solution (crow's foot notation)" is included in the Entity-Relationship Diagram (ERD) solution from the Software Development area of ConceptDraw Solution Park.
Crow's foot ERD
.png--diagram-flowchart-example.png)
HelpDesk
How to Draw a Pictorial Chart in ConceptDraw PRO

- Entity Relationship Diagram Symbols and Meaning ERD Symbols ...
- Design elements - ERD (crow's foot notation) | Entity Relationship ...
- Symbols Used In Entity Relation Models
- Oo Design Relation Symbols
- How To Create the Interaction ( Relation ) Diagram | PROBLEM ...
- Components of ER Diagram | Entity Relationship Diagram Symbols ...
- Entity Relationship Diagram Symbols | Data Flow Diagram Symbols ...
- Entity Relationship Diagram Symbols and Meaning ERD Symbols ...
- Symbols Used In Entity Relation Diagram
- ( Relation ) Diagram
- Electrical Schematic Symbols | Design elements - IDEF3 process ...
- Components of ER Diagram | Entity Relationship Diagram Symbols ...
- Entity Relation Modeling
- Electrical Schematic Symbols | Design elements - IDEF3 process ...
- Basic Flowchart Symbols and Meaning | Flowchart design ...
- Cross-Functional Flowcharts | Basic Flowchart Symbols and ...
- Basic Flowchart Symbols and Meaning | Process Flowchart ...
- Entity Relationship Diagram Symbols and Meaning ERD Symbols ...
- Electrical Diagram Symbols | Electrical Schematic Symbols | Piping ...
- Symbols In Entity Relation Diagram