This arrow loop diagram sample was created on the base of the figure illustrating the webpage "Safe Roads for a Safer Future A Joint Safety Strategic Plan" from the website of US Department of Transportation - Federal Highway Administration (FHWA) Office of Safety.
"STRATEGIC PLANNING CYCLE.
After the safety units issue the SSP, they will identify and prioritize strategies to support the established goals. Many strategies will originate in existing roadmaps or in other program planning activities. The safety units will also use this information when developing their Unit Performance Plans and individual performance plans. Teams within each safety unit will carry out projects and activities to support identified strategies and achieve the SSP goals.
The SSP process also includes continuous performance monitoring and evaluation through which the safety units will review past accomplishments against the established goals, consider how well strategies are implemented, assess progress toward goals, identify risks, consider changes in the environment, and discuss future strategic direction. As a part of the evaluation process, the three safety units will recognize achievements and discuss the need for adjustments. Figure ... shows the strategic planning cycle.
The safety units will update the SSP every 3 to 5 years using input from a variety of sources, including evaluations, safety trends, and legislative changes." [safety.fhwa.dot.gov/ ssp/ ]
The arrow loop diagram example "Strategic planning cycle" was created using the ConceptDraw PRO diagramming and vector drawing software extended with the Target and Circular Diagrams solution from the Marketing area of ConceptDraw Solution Park.
www.conceptdraw.com/ solution-park/ marketing-target-and-circular-diagrams
Arrow loop diagram
This arrow ring chart sample was created on the base of the figure illustrating the webpage "National Preparedness Cycle. Plan" from the Federal Emergency Management Agency (FEMA) website. "Planning makes it possible to manage the entire life cycle of a potential crisis. Strategic and operational planning establishes priorities, identifies expected levels of performance and capability requirements, provides the standard for assessing capabilities and helps stakeholders learn their roles. The planning elements identify what an organization’s Standard Operating Procedures (SOPs) or Emergency Operations Plans (EOPs) should include for ensuring that contingencies are in place for delivering the capability during a large-scale disaster." [fema.gov/ plan]
The arrow ring chart example "National Preparedness Cycle" was created using the ConceptDraw PRO diagramming and vector drawing software extended with the Target and Circular Diagrams solution from the Marketing area of ConceptDraw Solution Park.
www.conceptdraw.com/ solution-park/ marketing-target-and-circular-diagrams
Arrow ring chart
HR infographics "Components of competency based management" was redesigned from the Wikipedia file: Competency-circle.jpg. [en.wikipedia.org/ wiki/ File:Competency-circle.jpg]
This file is licensed under the Creative Commons Attribution-ShareAlike 3.0 License. [creativecommons.org/ licenses/ by-sa/ 3.0/ ]
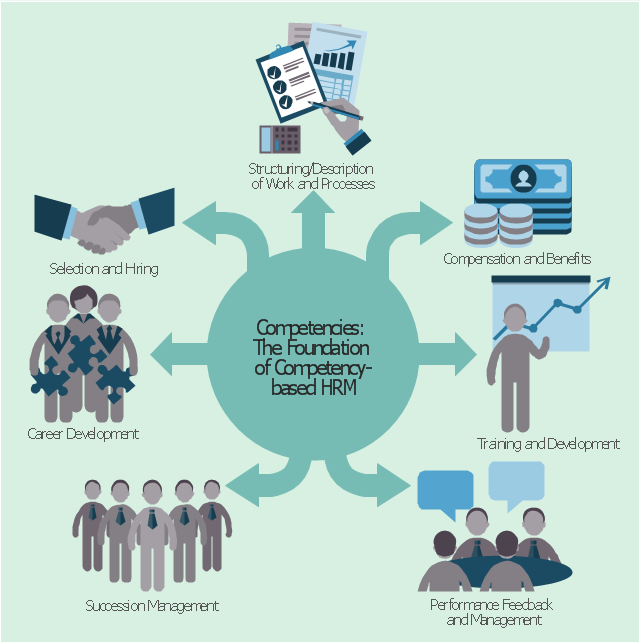
"Competency-based human resources planning serves as a link between human resources management and the overall strategic plan of an organization. Competencies are defined as observable abilities, skills, knowledge, motivations or traits defined in terms of the behaviours needed for successful job performance.
Competency-based management supports the integration of human resources planning with business planning by allowing organizations to assess the current human resource capacity based on their competencies against the capacity needed to achieve the vision, mission and business goals of the organization. Targeted human resource strategies, plans and programs to address gaps (e.g., hiring and staffing; learning; career development; succession management; etc.) are then designed, developed and implemented to close the gaps." [Competency-based management. Wikipedia]
The HR infographics example "Components of competency based management" was created using the ConceptDraw PRO diagramming and vector drawing software extended with the HR Flowcharts solution from the Management area of ConceptDraw Solution Park.
This file is licensed under the Creative Commons Attribution-ShareAlike 3.0 License. [creativecommons.org/ licenses/ by-sa/ 3.0/ ]
"Competency-based human resources planning serves as a link between human resources management and the overall strategic plan of an organization. Competencies are defined as observable abilities, skills, knowledge, motivations or traits defined in terms of the behaviours needed for successful job performance.
Competency-based management supports the integration of human resources planning with business planning by allowing organizations to assess the current human resource capacity based on their competencies against the capacity needed to achieve the vision, mission and business goals of the organization. Targeted human resource strategies, plans and programs to address gaps (e.g., hiring and staffing; learning; career development; succession management; etc.) are then designed, developed and implemented to close the gaps." [Competency-based management. Wikipedia]
The HR infographics example "Components of competency based management" was created using the ConceptDraw PRO diagramming and vector drawing software extended with the HR Flowcharts solution from the Management area of ConceptDraw Solution Park.
HR Infographics
 Circular Arrows Diagrams
Circular Arrows Diagrams solution extends ConceptDraw DIAGRAM with extensive drawing tools, predesigned samples, Circular flow diagram template for quick start, and a library of ready circular arrow vector stencils for drawing Circular Arrow Diagrams, Segmented Cycle Diagrams, and Circular Flow Diagrams. The elements in this solution help managers, analysts, business advisers, marketing experts, scientists, lecturers, and other knowledge workers in their daily work.
Advanced printing in ConceptDraw PROJECT

Circular Arrows
What is Gantt Chart (historical reference)

Flowchart design. Flowchart symbols, shapes, stencils and icons


Examples of Flowcharts, Org Charts and More


 Marketing Diagrams
Marketing Diagrams solution extends ConceptDraw DIAGRAM diagramming software with abundance of samples, templates and vector design elements intended for easy graphical visualization and drawing different types of Marketing diagrams and graphs, including Branding Strategies Diagram, Five Forces Model Diagram, Decision Tree Diagram, Puzzle Diagram, Step Diagram, Process Chart, Strategy Map, Funnel Diagram, Value Chain Diagram, Ladder of Customer Loyalty Diagram, Leaky Bucket Diagram, Promotional Mix Diagram, Service-Goods Continuum Diagram, Six Markets Model Diagram, Sources of Customer Satisfaction Diagram, etc. Analyze effectively the marketing activity of your company and apply the optimal marketing methods with ConceptDraw DIAGRAM software.
- Successful Strategic Plan | Strategic planning cycle - Arrow loop ...
- Program assessment plan - Arrow circle diagram | Strategic ...
- Strategic planning cycle - Arrow loop diagram | Basic Flowchart ...
- Strategic planning cycle - Arrow loop diagram | Strategic planning ...
- Water cycle diagram | Strategic planning - Cycle diagram | Strategic ...
- Strategic planning - Cycle diagram | Strategic planning cycle - Arrow ...
- Strategic planning cycle - Arrow loop diagram | SWOT analysis for a ...
- Innovation life cycle - Arrow loop diagram | Strategic planning cycle ...
- | Strategic planning - Cycle diagram | Best Strategic Planning ...
- Design elements - Fault tree analysis diagrams | Strategic planning ...